
Annual Report 2025 - 26
Contents
1. Total number of lets per local authority
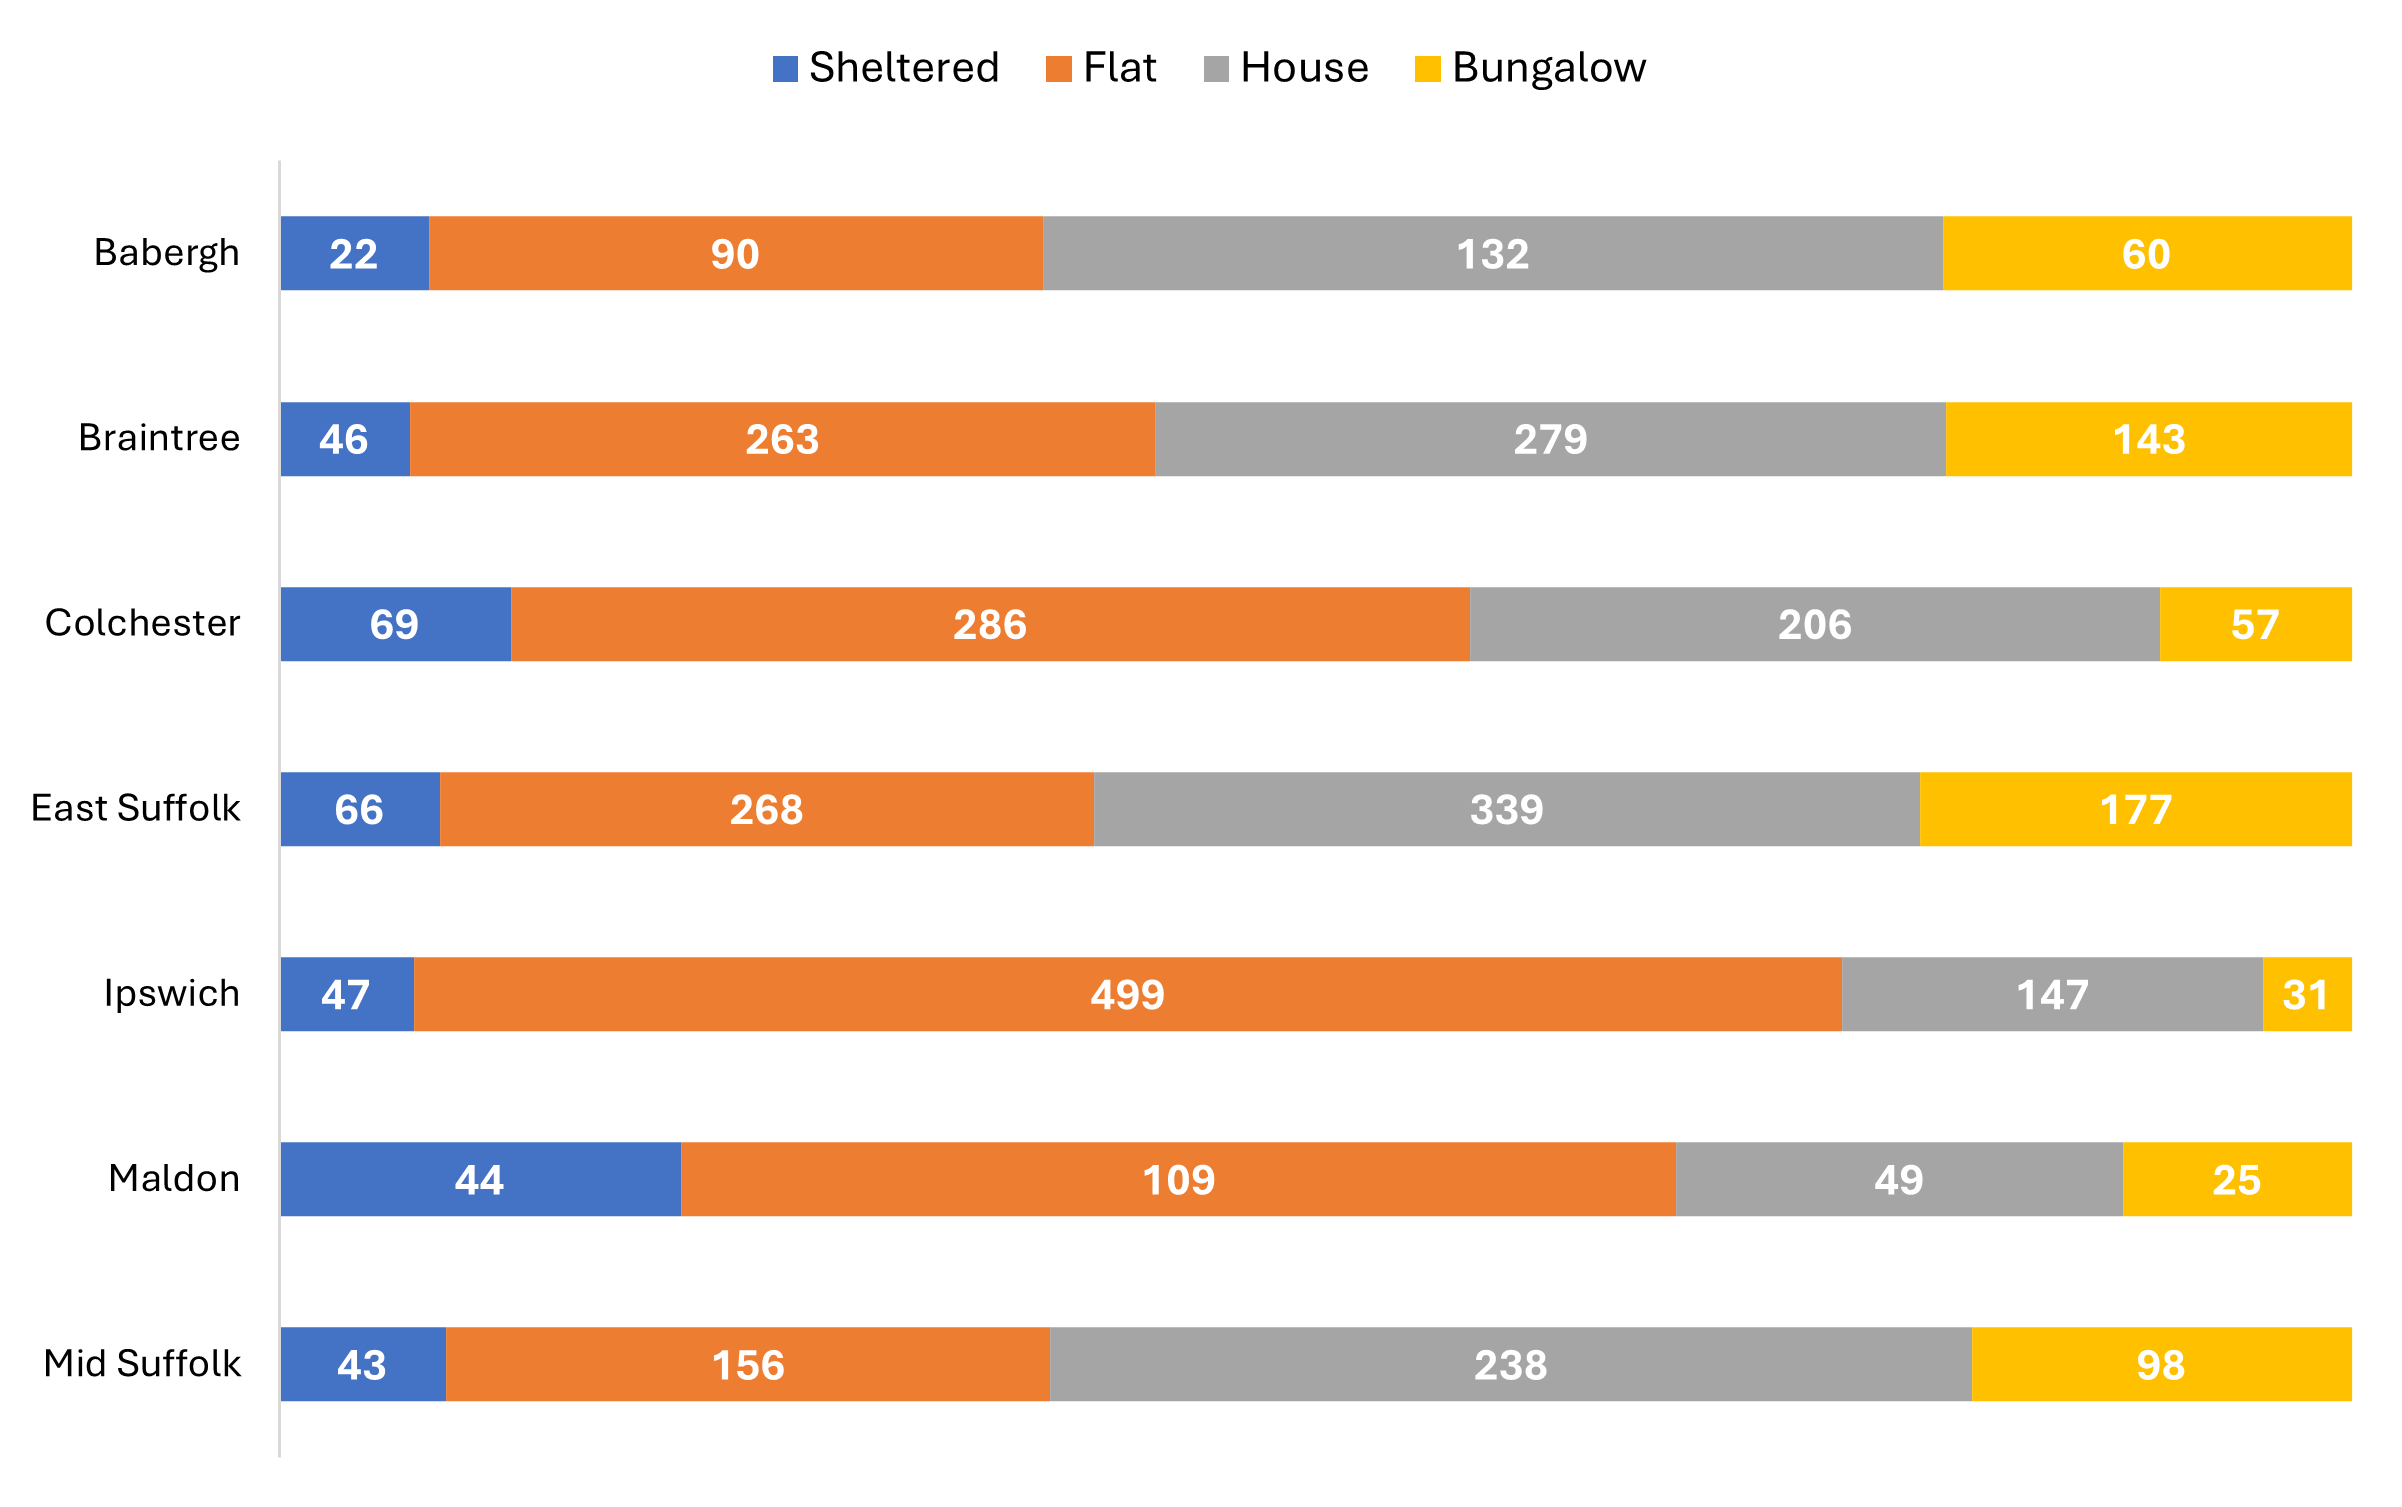
2 Total lets split by rent type
3. Total lets split by number of bedrooms
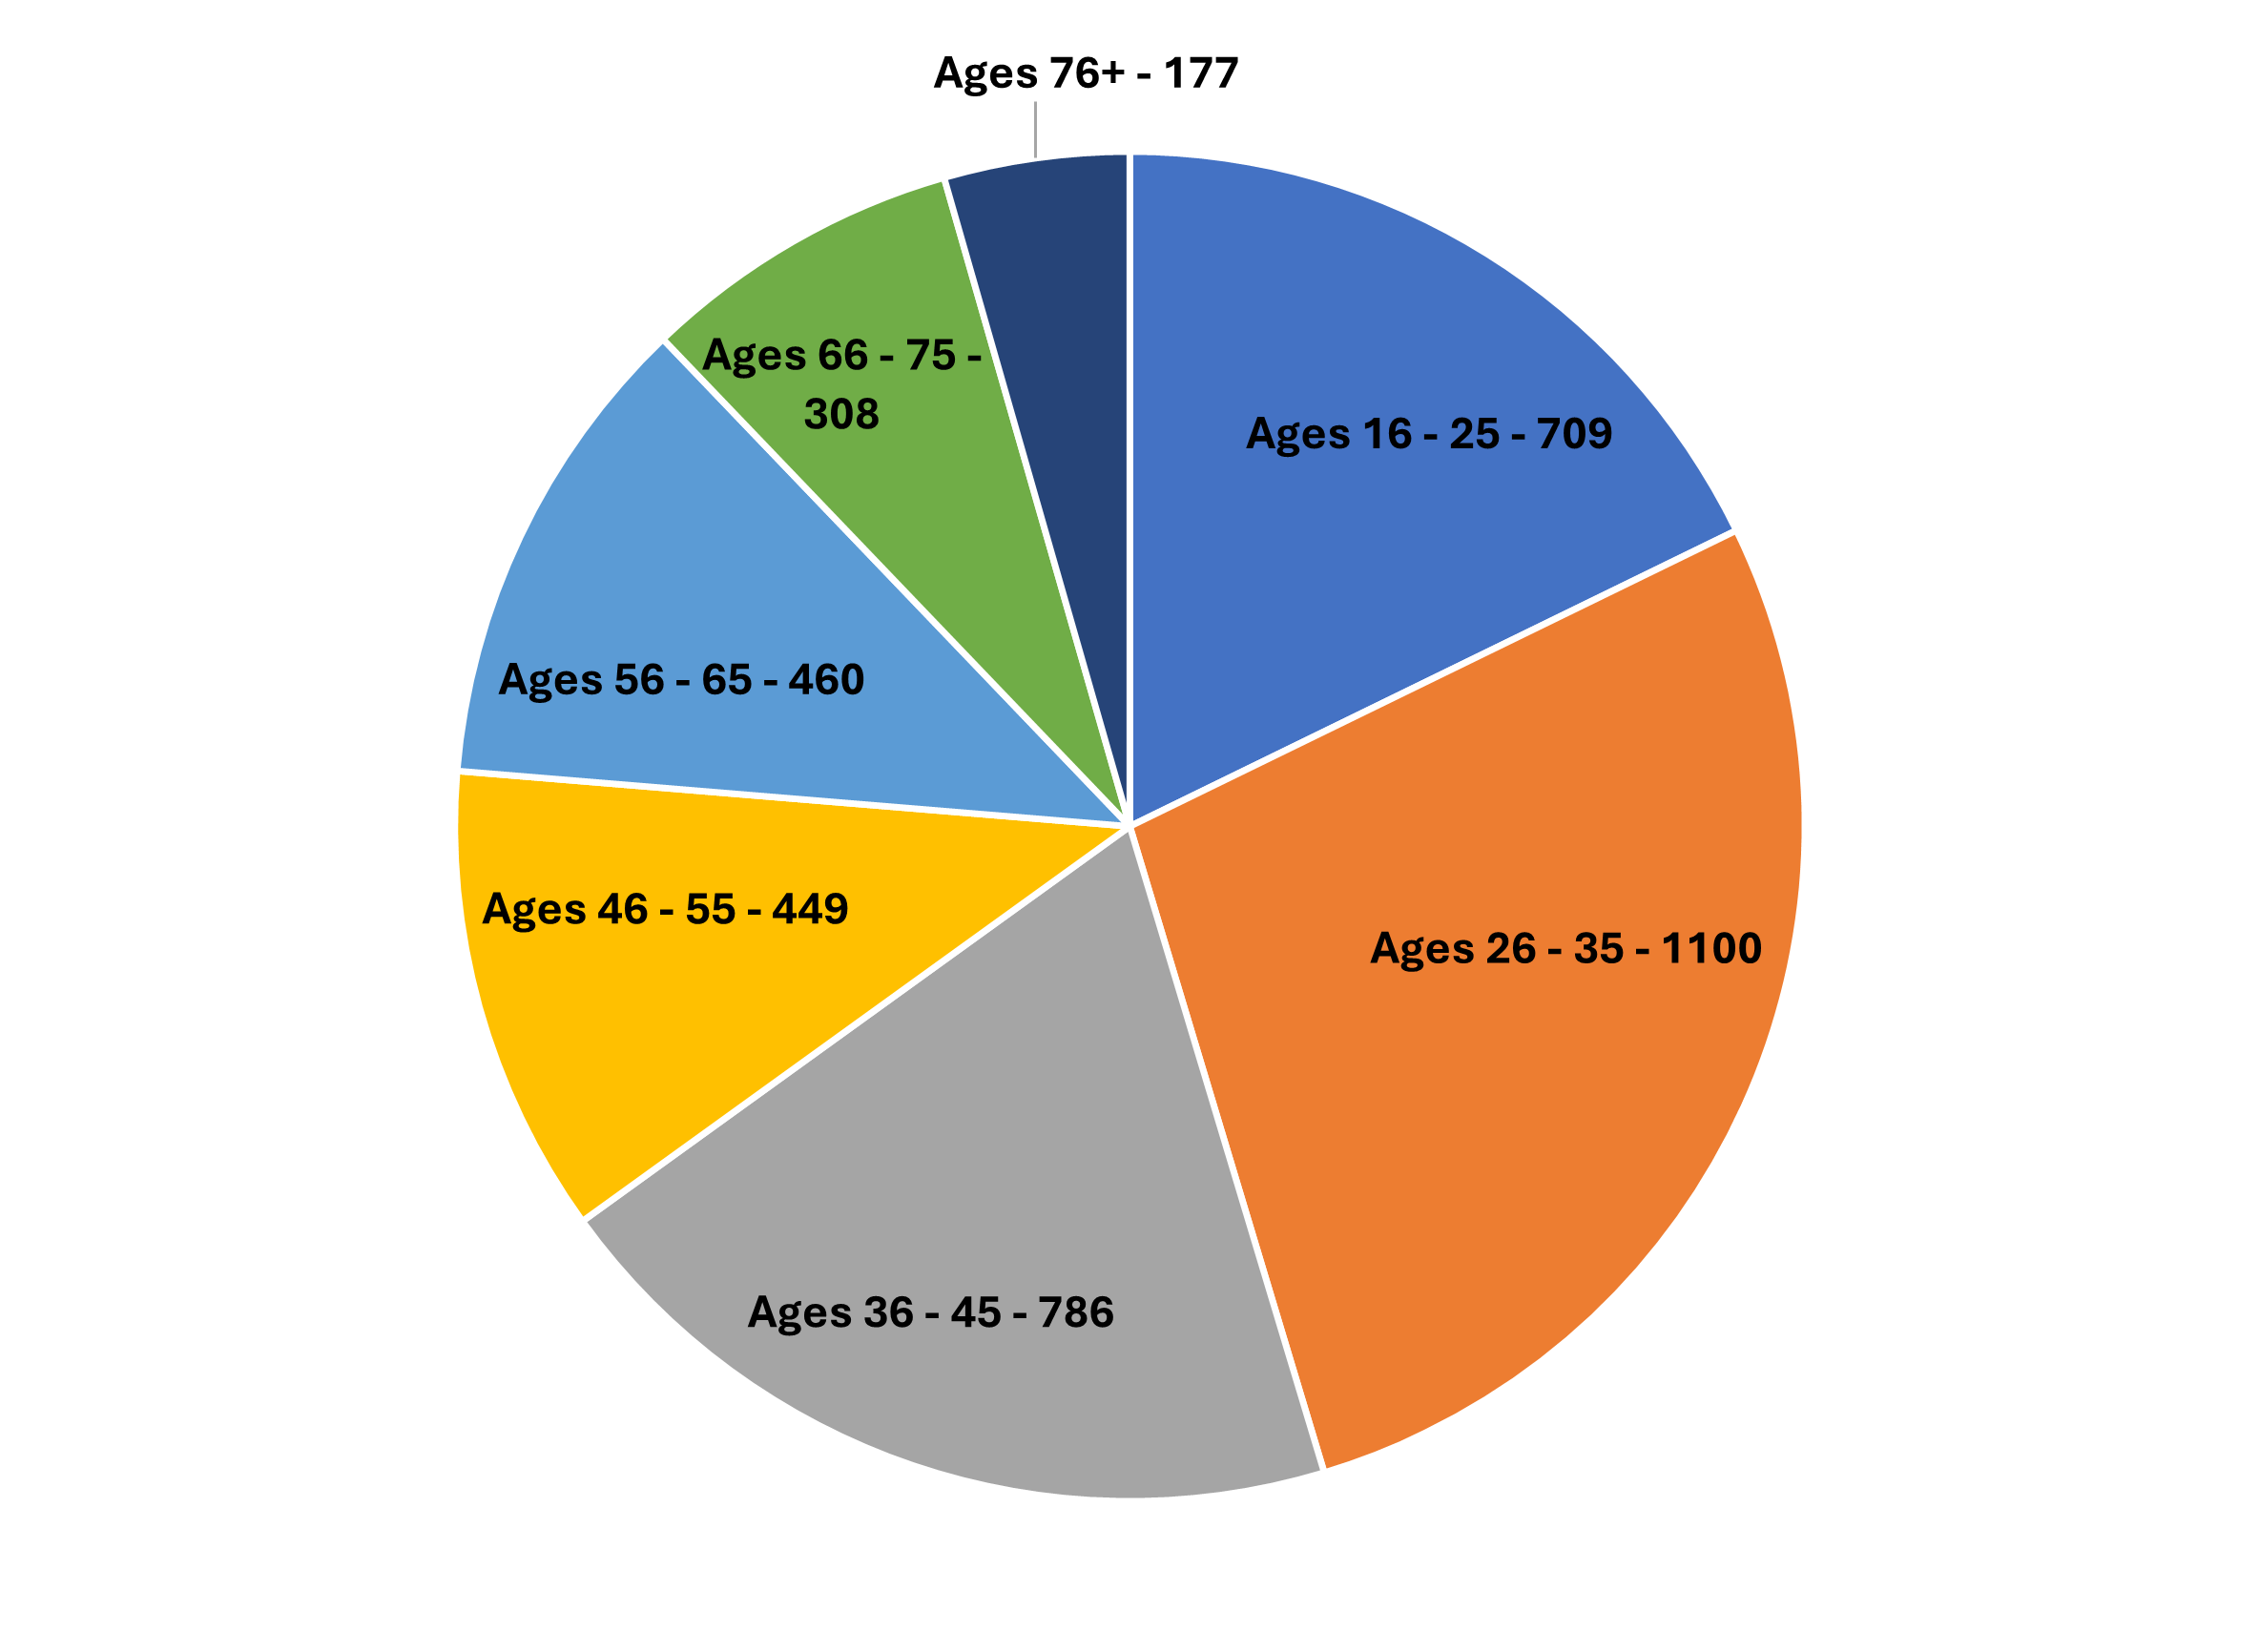
4. Total lets split by age of main applicant
7. Applicants housed in 2025 - 26 through Gateway to Homechoice split by applicant type
9. 2025 - 26 Waiting times by Band in months
9a. 2025 - 26 Waiting times by Bedroom size in months
10. The movement of households hosued through Gateway to Homechoice in 2025 - 26
12. Gateway to Homehoice Armed Forces data
13. Gateway to Homechoice Active Applicants data by Band as of 1st April 2026
Gateway to Homechoice Annual Report 2025 - 26
This report is intended to summarise the main outcomes for the last year of the Gateway to Homechoice system of choice-based lettings.
How the Scheme Operates
Gateway to Homrechoice is a choice-based lettings system, where social housing properties are advertised in the Local Authority areas of Babergh, Braintree, Colchester, East Suffolk, Ipswich, Maldon and Mid Suffolk. The scheme allows one point of access for customers to apply to a Local authority housing egister and be considered for available properties in any of the areas.
The 7 Local Authorities (LAs) in the Gateway to Homechoice scheme advertise vacancies in rented social housing using the same system that operates as follows:
- The Local Authorities use a single IT system and website for registering applicants and advertising and allocating properties.
- Each week, the vacant social housing in the area of operation of the 7 LAs is advertised on the Gateway to Homechoice website
- Applicants who are registered can indicate up to 2 properties they are interested in either online or by phone.
- All the vacancies advertised through the scheme are owned by Local Authorities or housing associations.
- All the LAs operate the same Allocation Policy.
- The Allocations Policy sets out:
- how to register;
- how registered applicants can choose where they live; and
- how the property is allocated to a specific household.
Qualification and Local Connection
People register with the Local Authority where they live (or would like to live if they come from outside the sub-region of the scheme). Applicants with no local connection to any of the LAs are ‘demoted’ by one Band compared to someone with the same housing issue from within the area. An applicant will be considered to have a local connection to the sub-region if:
- their only or principal home is in one of the participating districts; or
- they were placed in specialised housing outside the sub-region, but previously lived here; or
- they are in permanent paid work in the sub-region; or
- they have an adult son, daughter, brother, sister, mother or father who lives here and has done so for at least 5 years.
Shortlisting
The principle of the system is that properties are normally let to the household that wants the property and has been waiting the longest in the highest Band.
Available properties are advertised on the Gateway to Homechoice website for one week, starting on Thursday morning and closing on the following Wednesday at midnight. As people place their bids for housing, the system automatically compiles a shortlist of applicants. The order of the applicants is from Band A down to Band E. If 2 or more applicants have the same Band, then the system will normally place the applicant with the longest date first.
The Gateway to Homechoice Project Board
The Gateway to Homechoice Project Board meets remotely bimonthly to work collaboratively on the monitoring and development of the Gateway to Homechoice scheme. It is a senior officer group of representatives from the Gateway local authorities. Its objectives are to:
- Oversee the management of the Choice Based Lettings Scheme;
- Determine the strategic direction of scheme (incl. but not limited to determining the advertising fee for the relevant period);
- Make key strategic decisions about the structure and operation of the scheme;
- Confirm the appointment of any external partners or sub-contractors deemed appropriate to facilitate the operation of the scheme;
- Monitor the financial aspects of the CBL Scheme ensuring that there are sufficient resources to operate the scheme;
- Monitor the performance of the database provider;
- Appoint the lead authority; and
- Establish sub-groups, membership, and terms of reference.
The Gateway to Homechoice Operations Group
The Gateway to Homechoice Operations Group consists of members from local authorities and Large Scale Voluntary Transfer (LSVT) representatives who meet every other month.
The Operations Group is responsible for identifying issues and solutions to day-to-day operations, in addition to regularly reviewing and developing the Gateway to Homechoice scheme procedures and other projects, as identified by the Project Board.
The Gateway to Homechoice RP Group
The Gateway to Homechoice RP (Registered Providers) Group consists of representatives who are part of the Gateway to Homechoice Choice-based lettings scheme who meet remotely every 12 weeks for information exchange, updates, identifying issues and solutions and are involved with the development of the scheme’s policies and procedures
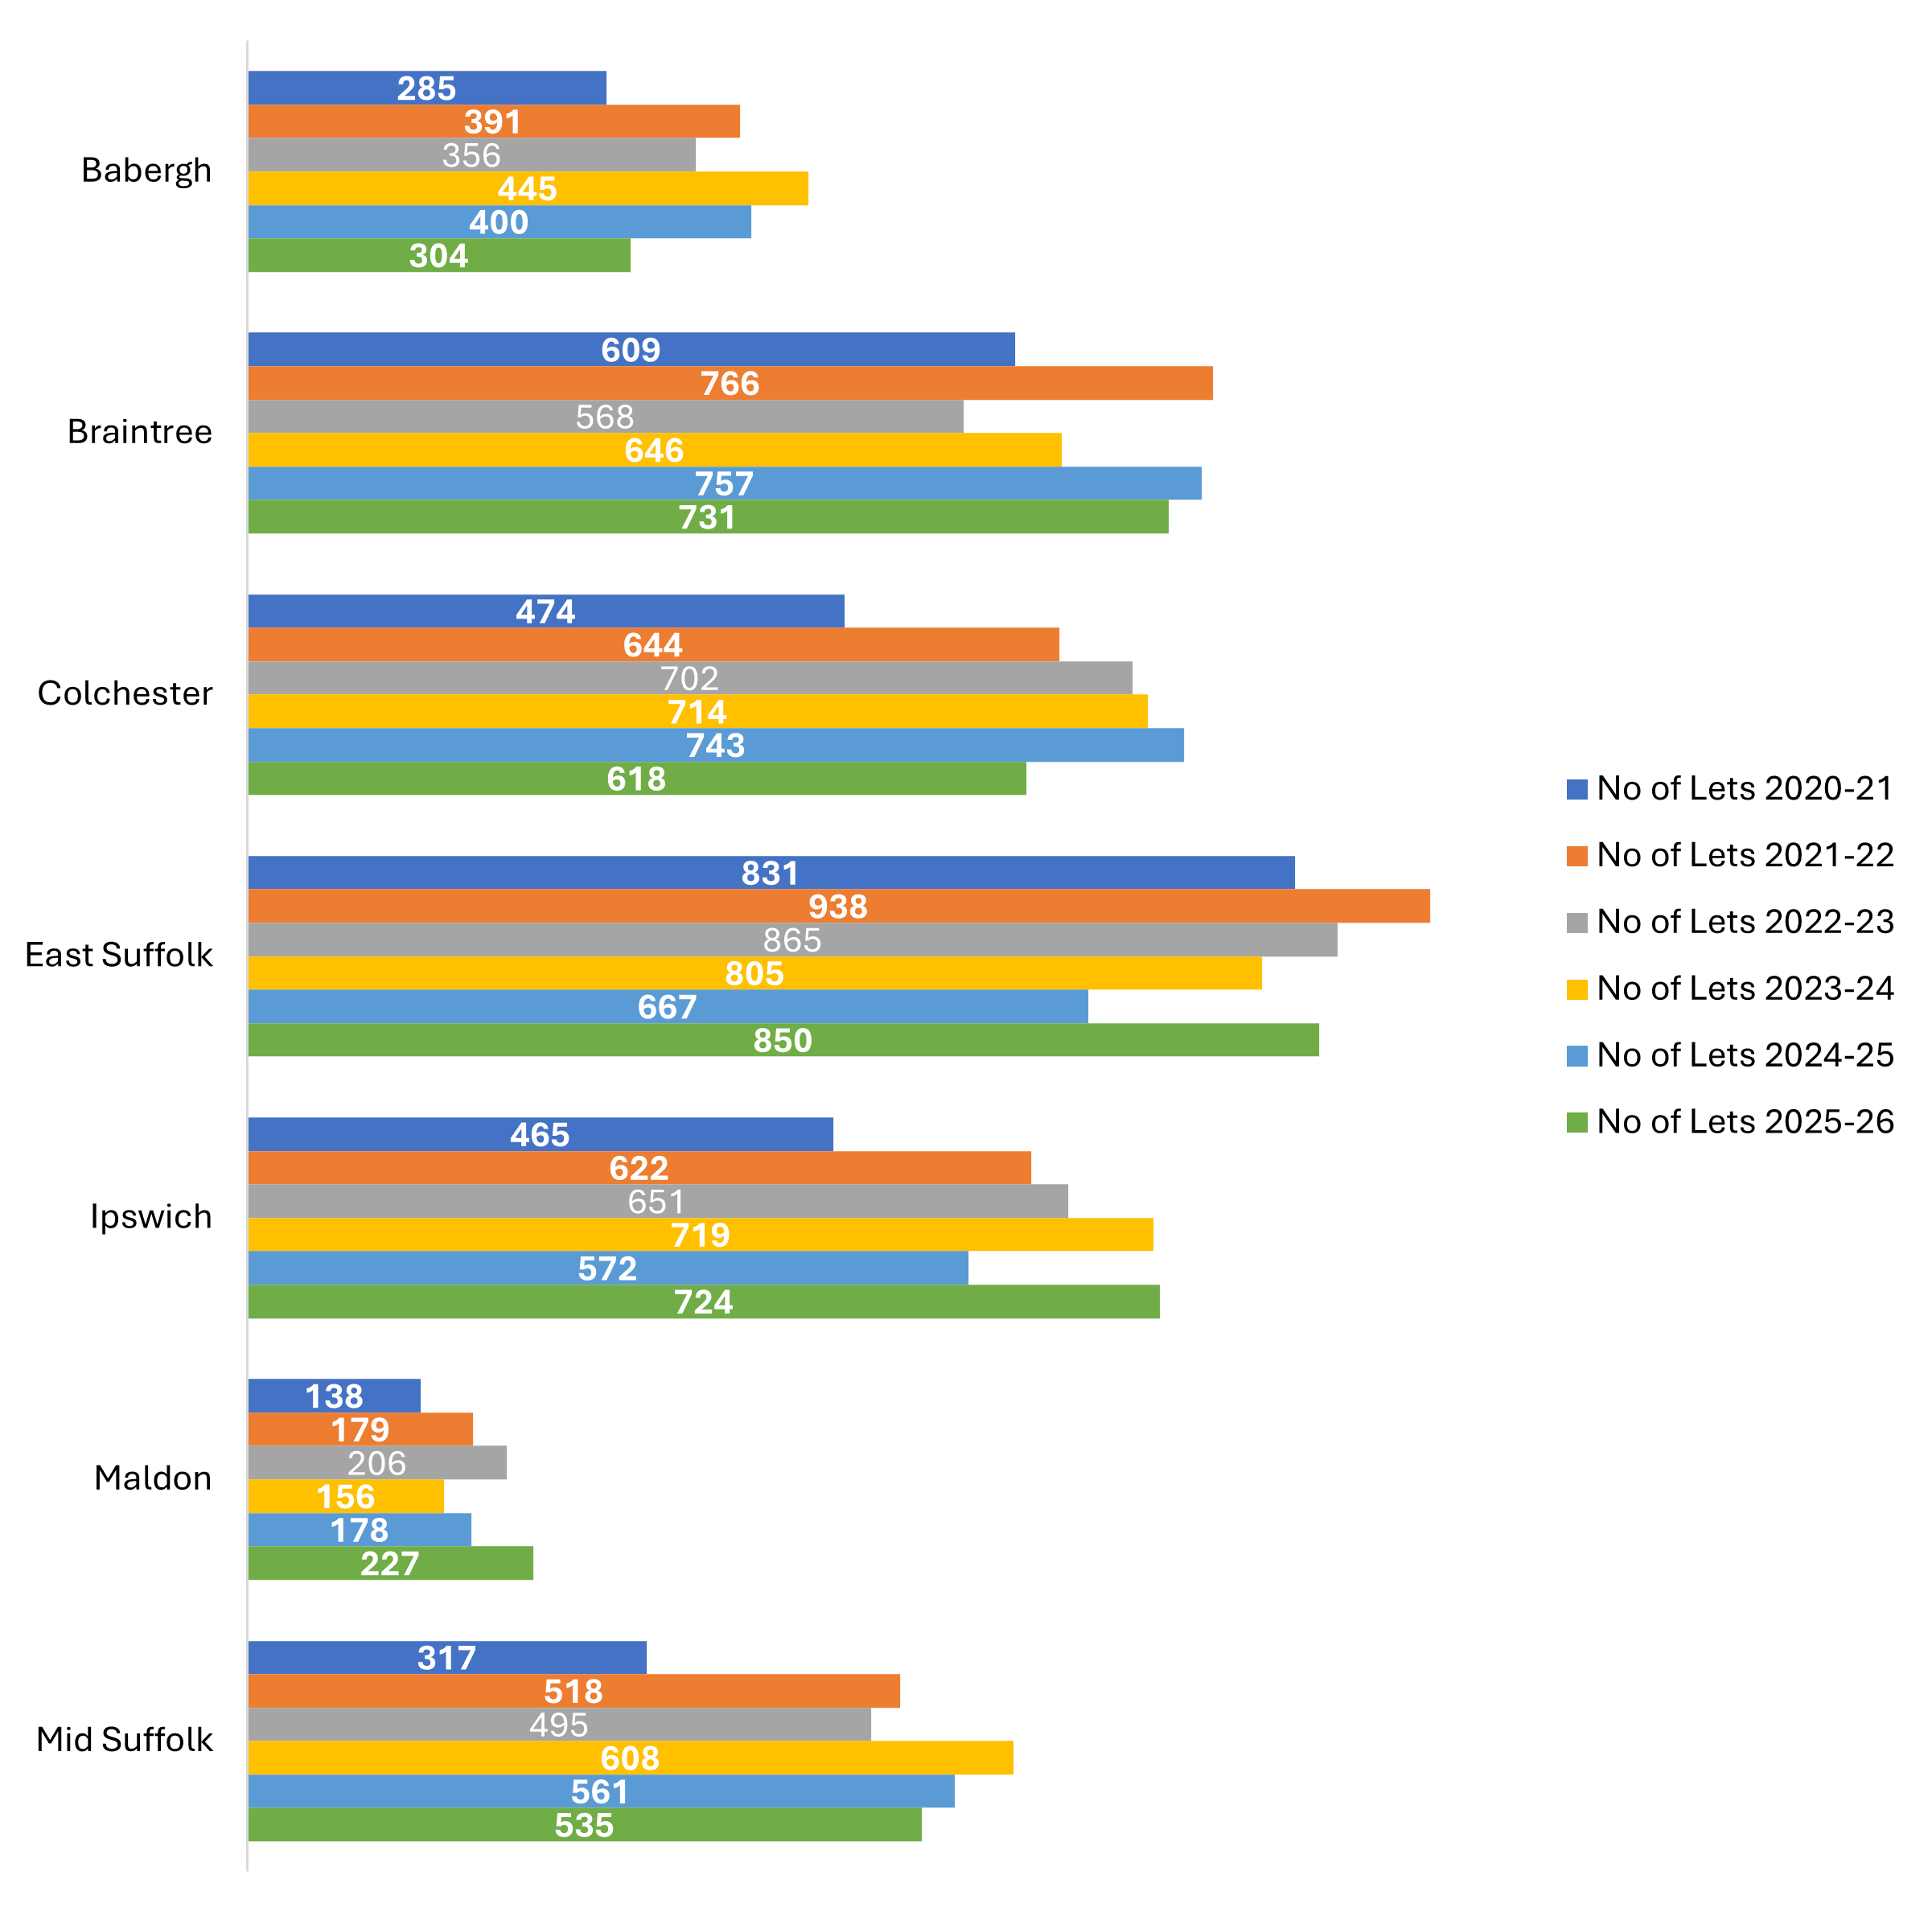
1. Number of properties let in each local authority through Gateway to Homechoice between 2020 – 26
The number of properties that become available to let each year is affected by a number of factors but the main ones are:
- the number of rented social homes in the area and
- the number of new affordable homes completed in that year.
The variations between the LAs reflects mainly the size of their social rented sector. For example, Ipswich have the largest number of social homes, while Maldon has the smallest number. The changes from one year to the next within a local authority area usually reflect the variation in the number of new homes provided.
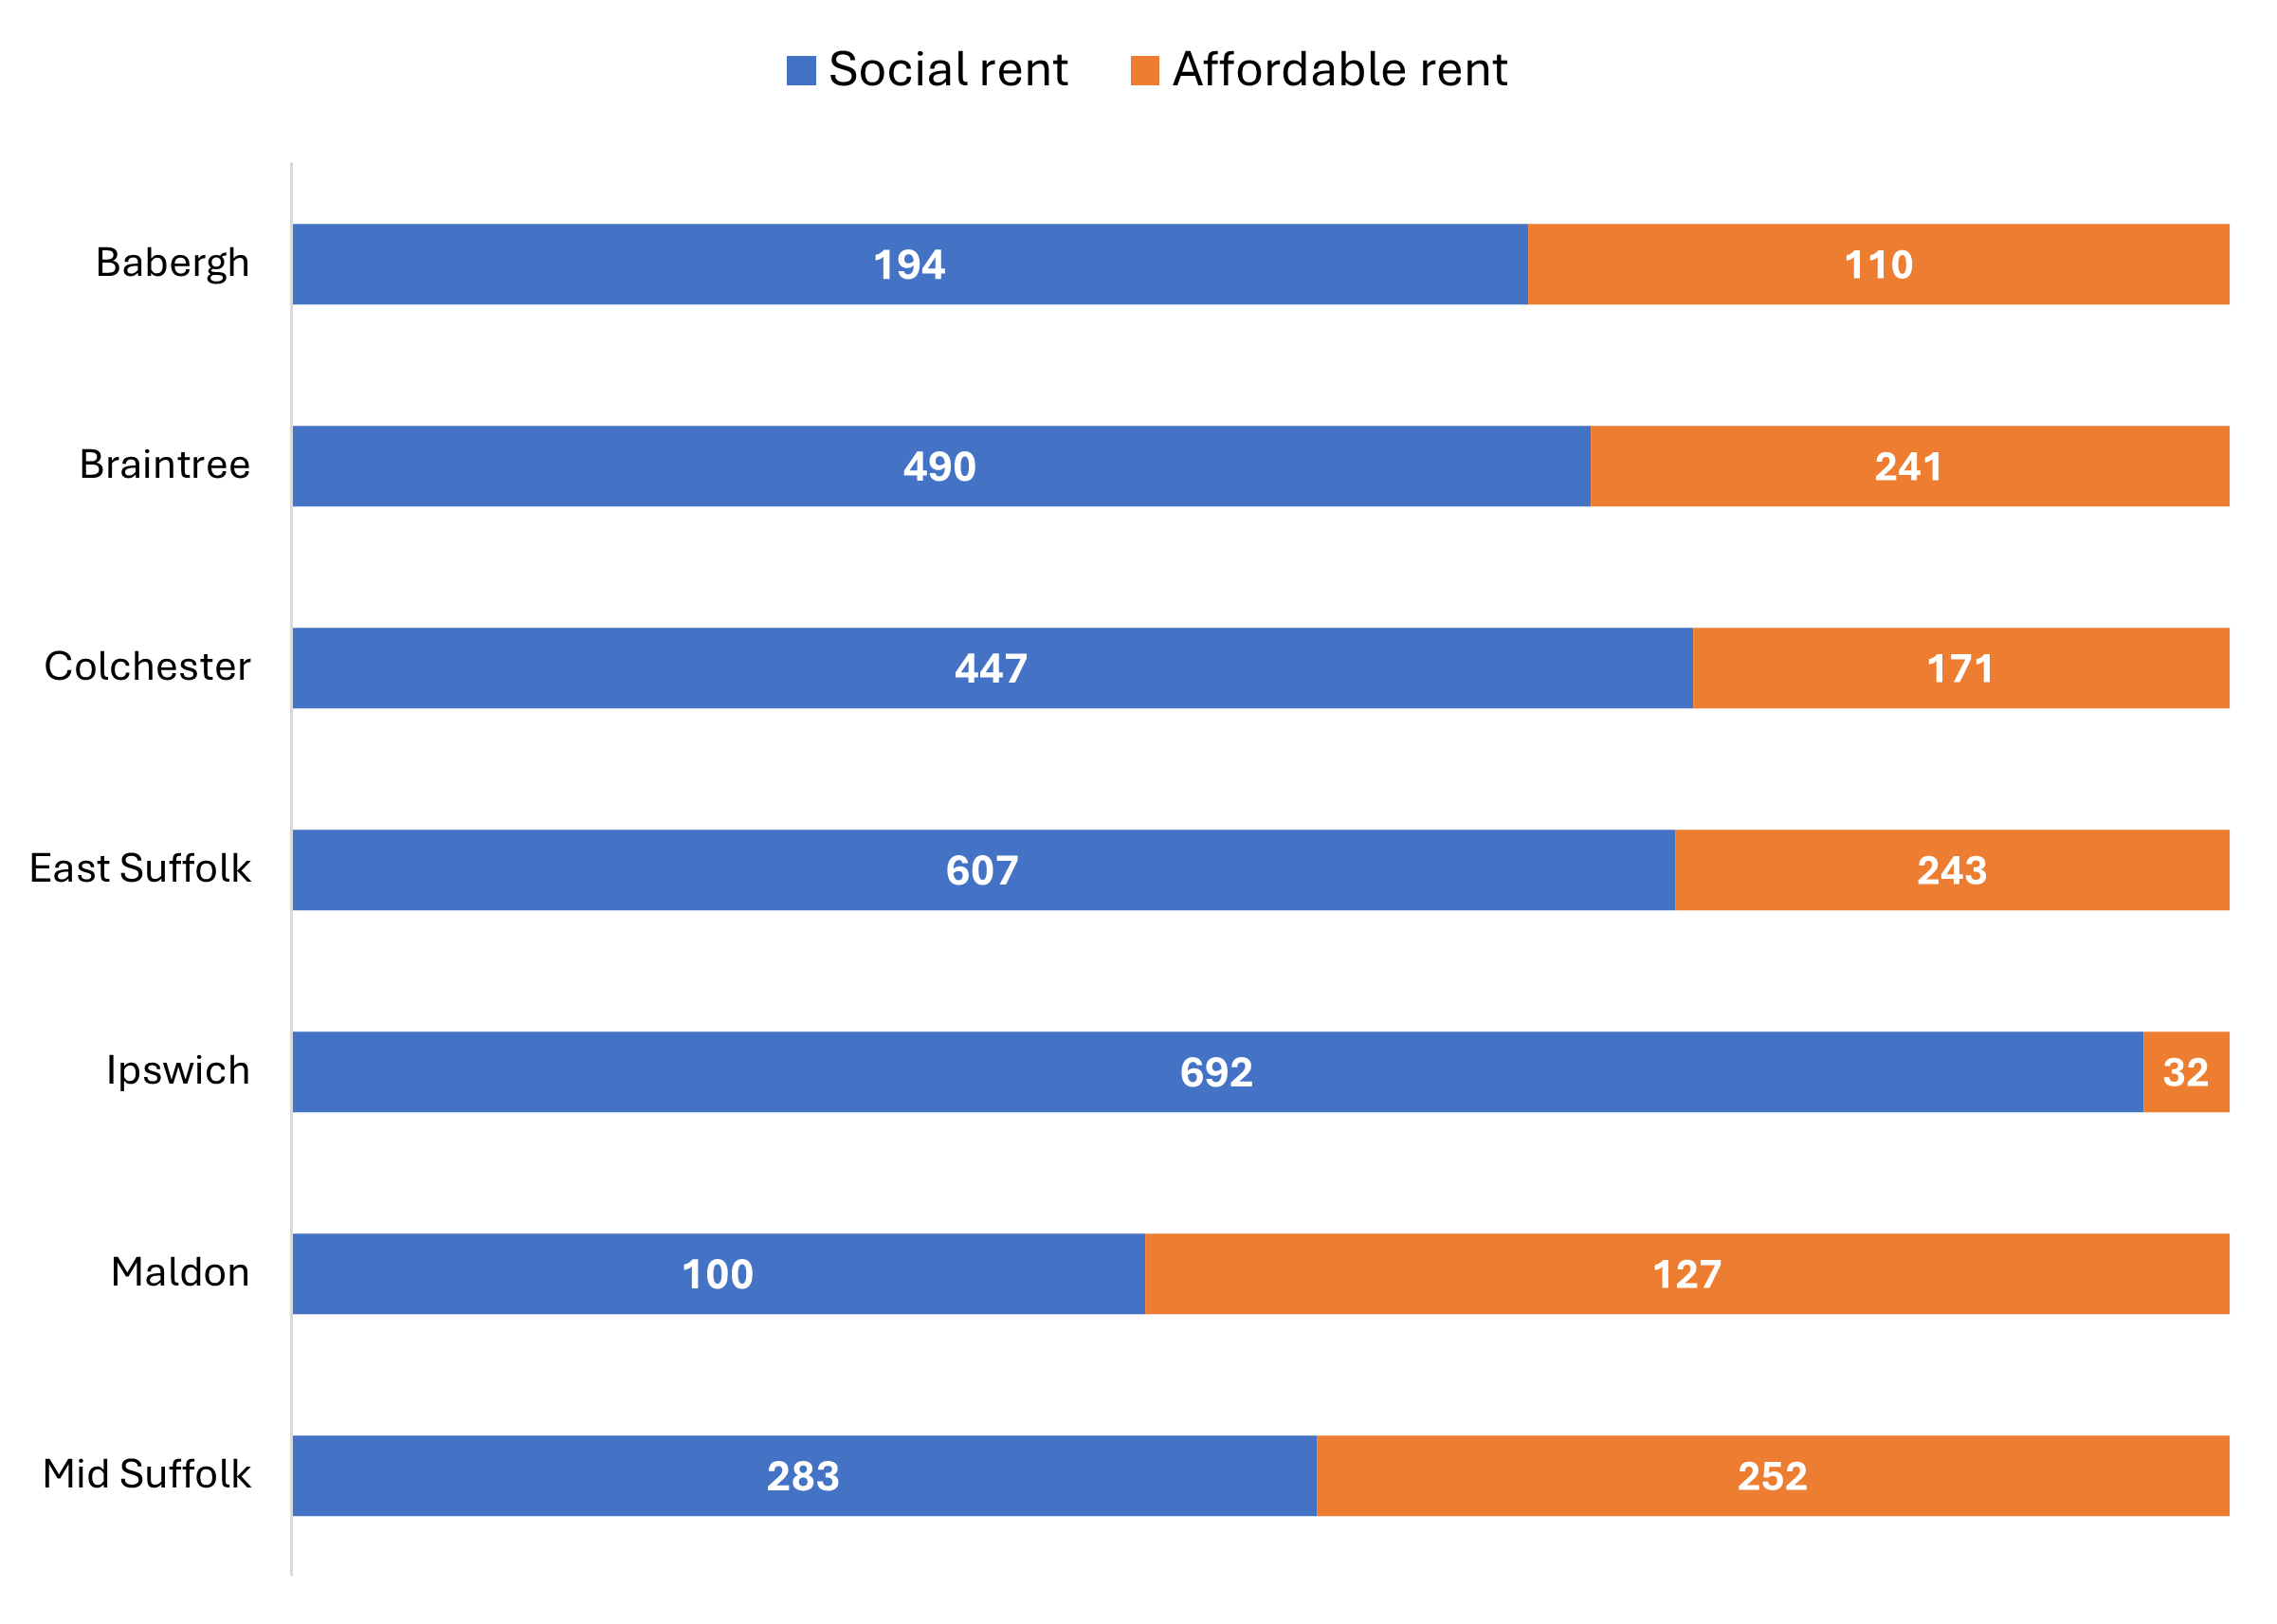
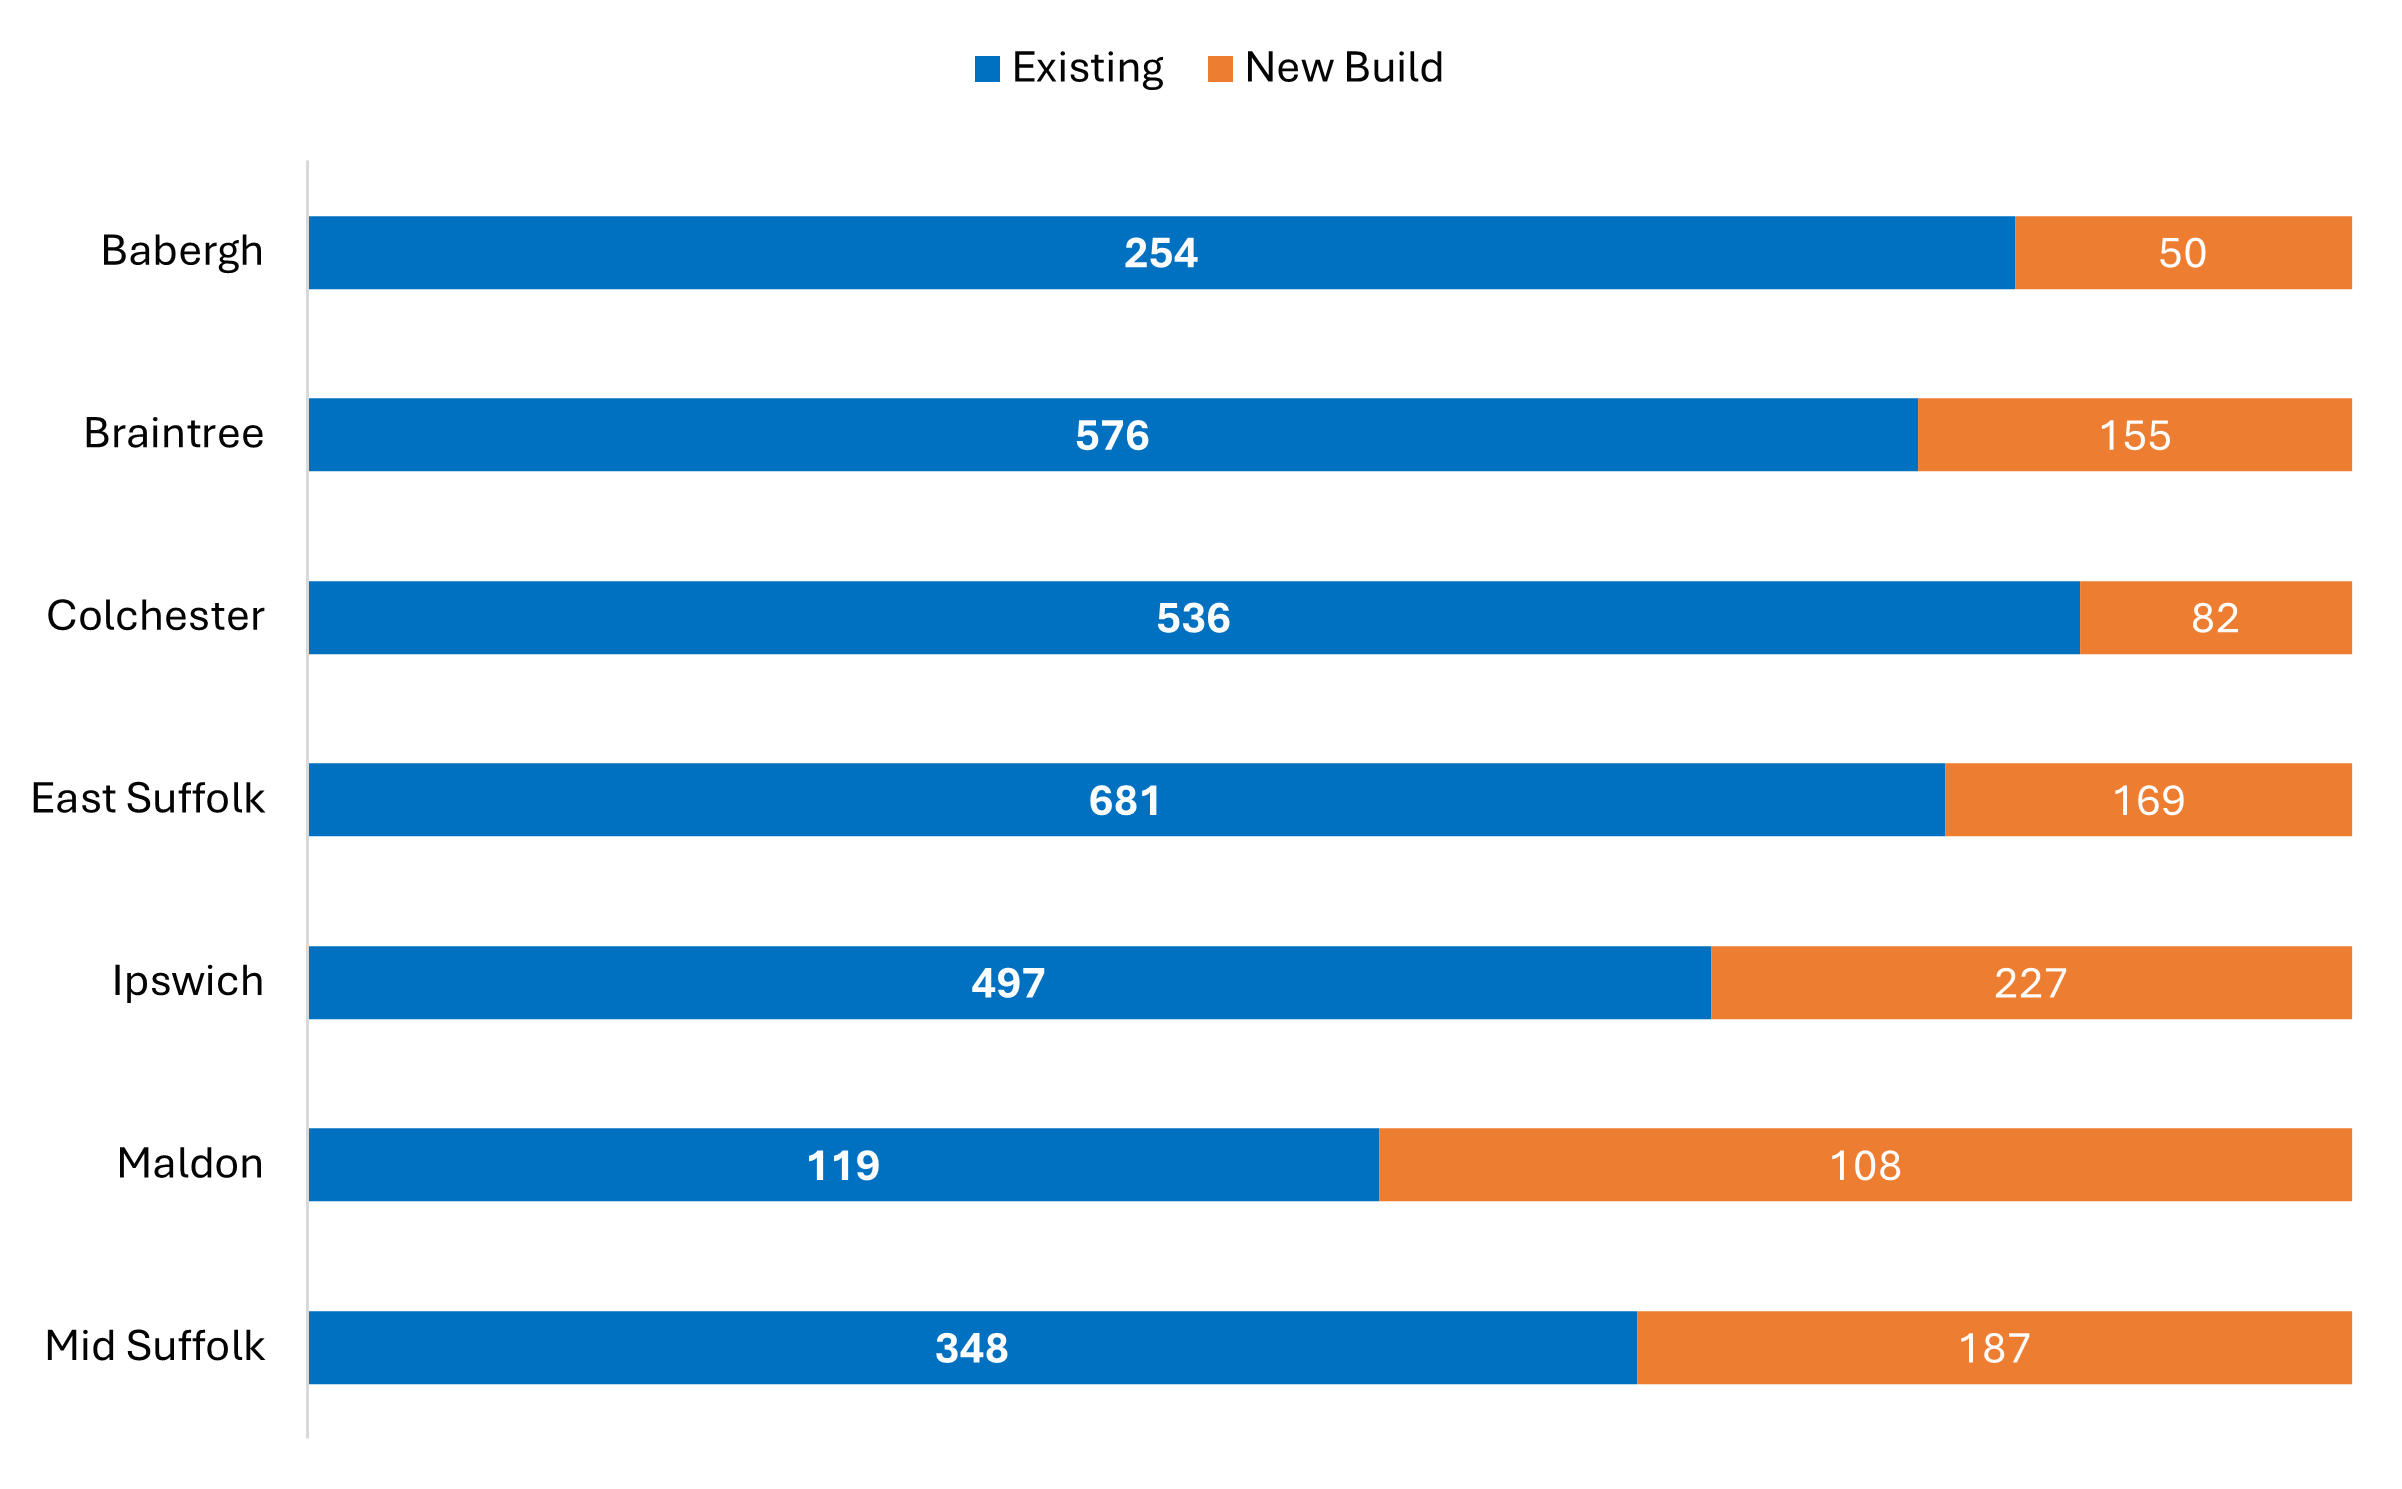
2. Total number of properties let in each local authority in 2025 - 26 split by type of rent
Social housing for rent can be let at social or affordable rent levels. Social rent is set using a formula that considers local earnings and house prices, while affordable rent is set at no more than 80% of market rent. In general, affordable rents are higher than social rents and the gap between them is larger for bigger properties.
Affordable rents are usually charged for all new social housing. Some housing providers also ‘convert’ properties from social rent to affordable rent when they become vacant. This raises money to invest in new affordable housing.
3. Total number of properties let in 2025 - 26 split by the number of bedrooms in the property
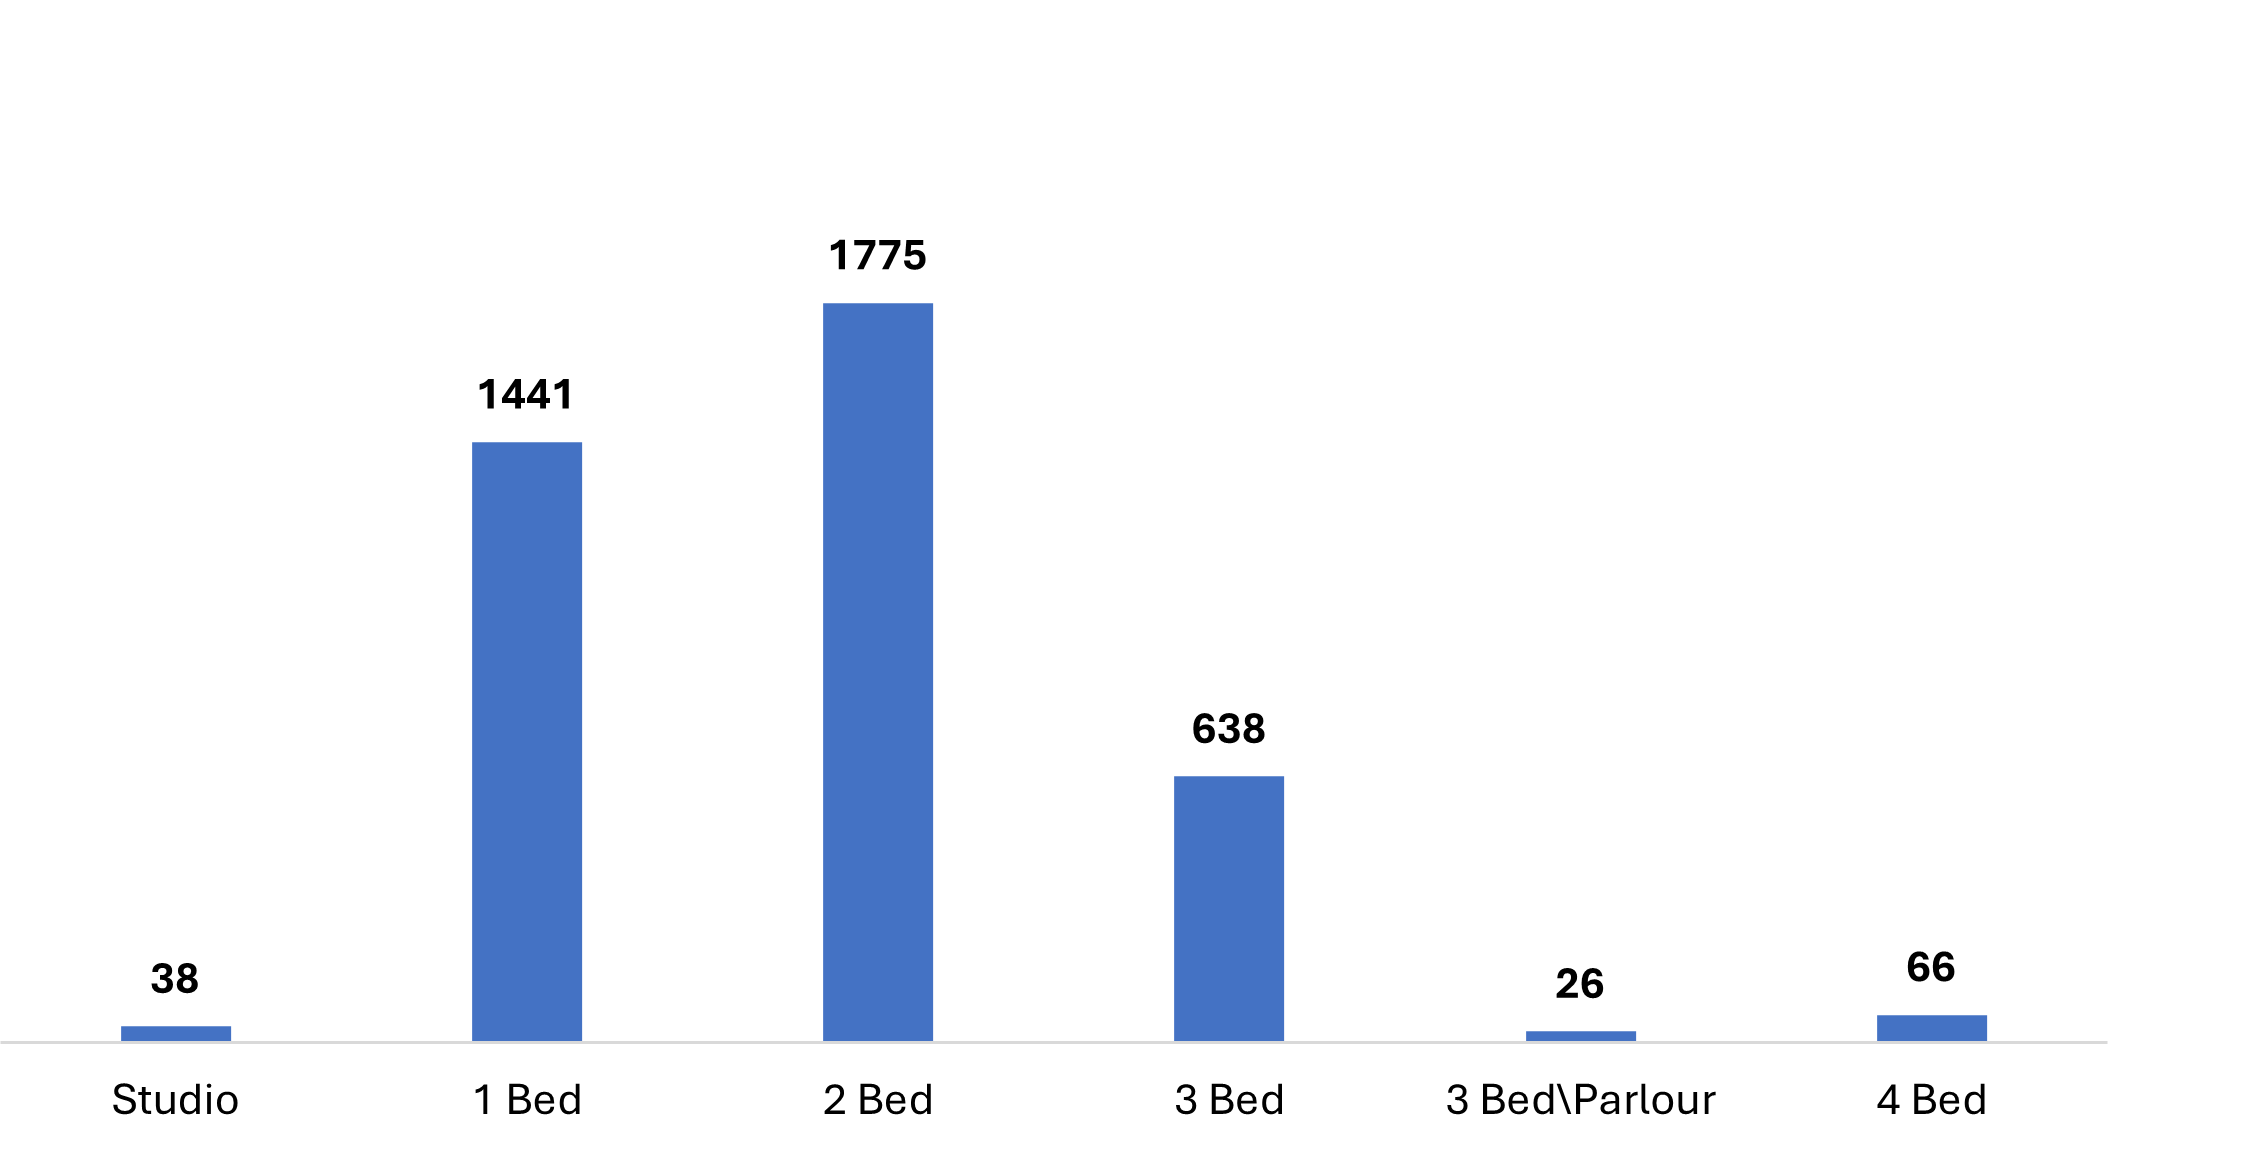
There were also five x 5 beds let during this year.
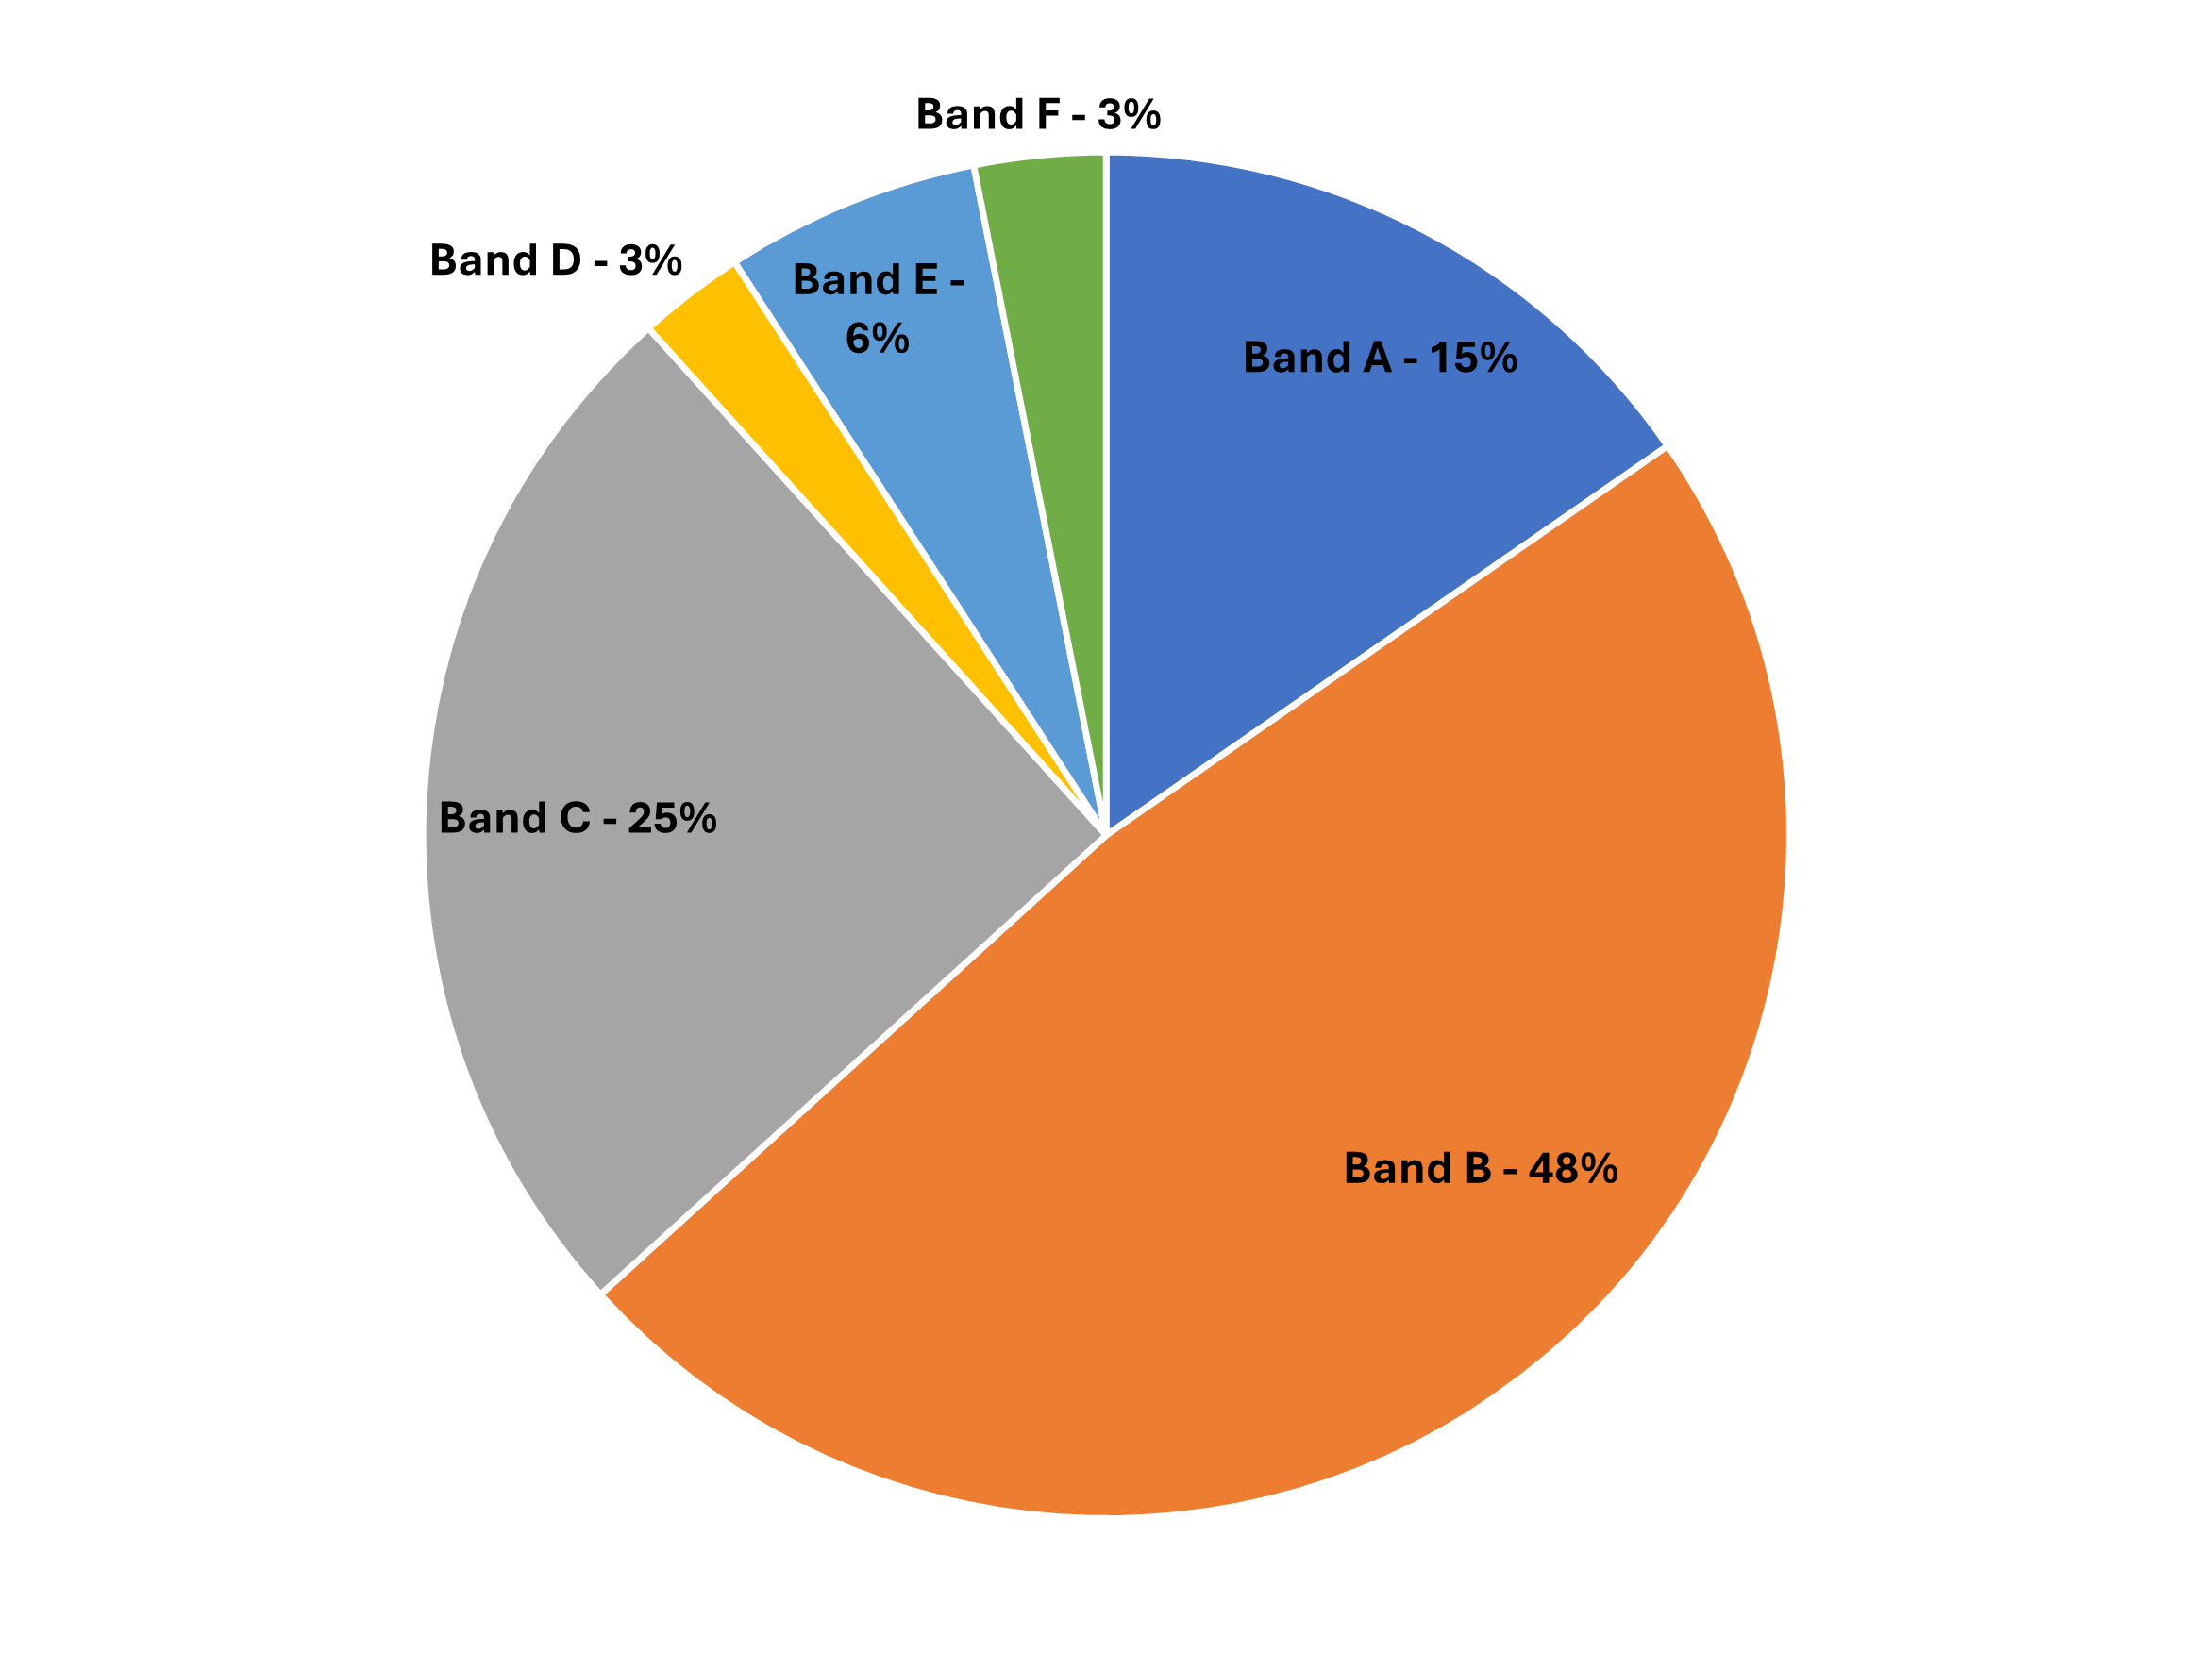
About ‘Bands’
When someone applies for housing, the urgency of their application is assessed in line with the Allocations Policy, which can be viewed and downloaded from the scheme’s website. Applications are placed in ‘Bands’ from A to F, depending on the level of need. The main categories of need for each band are summarised below. (Please look at the website if you want a complete guide to the banding scheme).
|
Band |
Main categories of need |
|
Band A |
|
|
Band B |
|
|
Band C |
|
|
Band D |
|
|
Band E |
|
|
Band F |
|
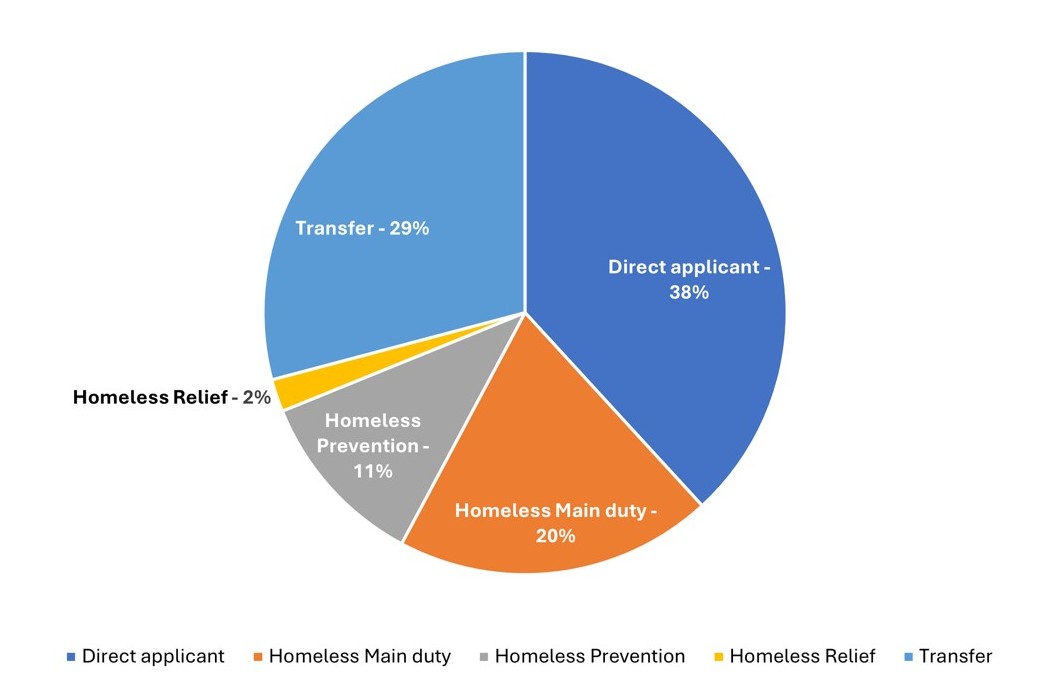
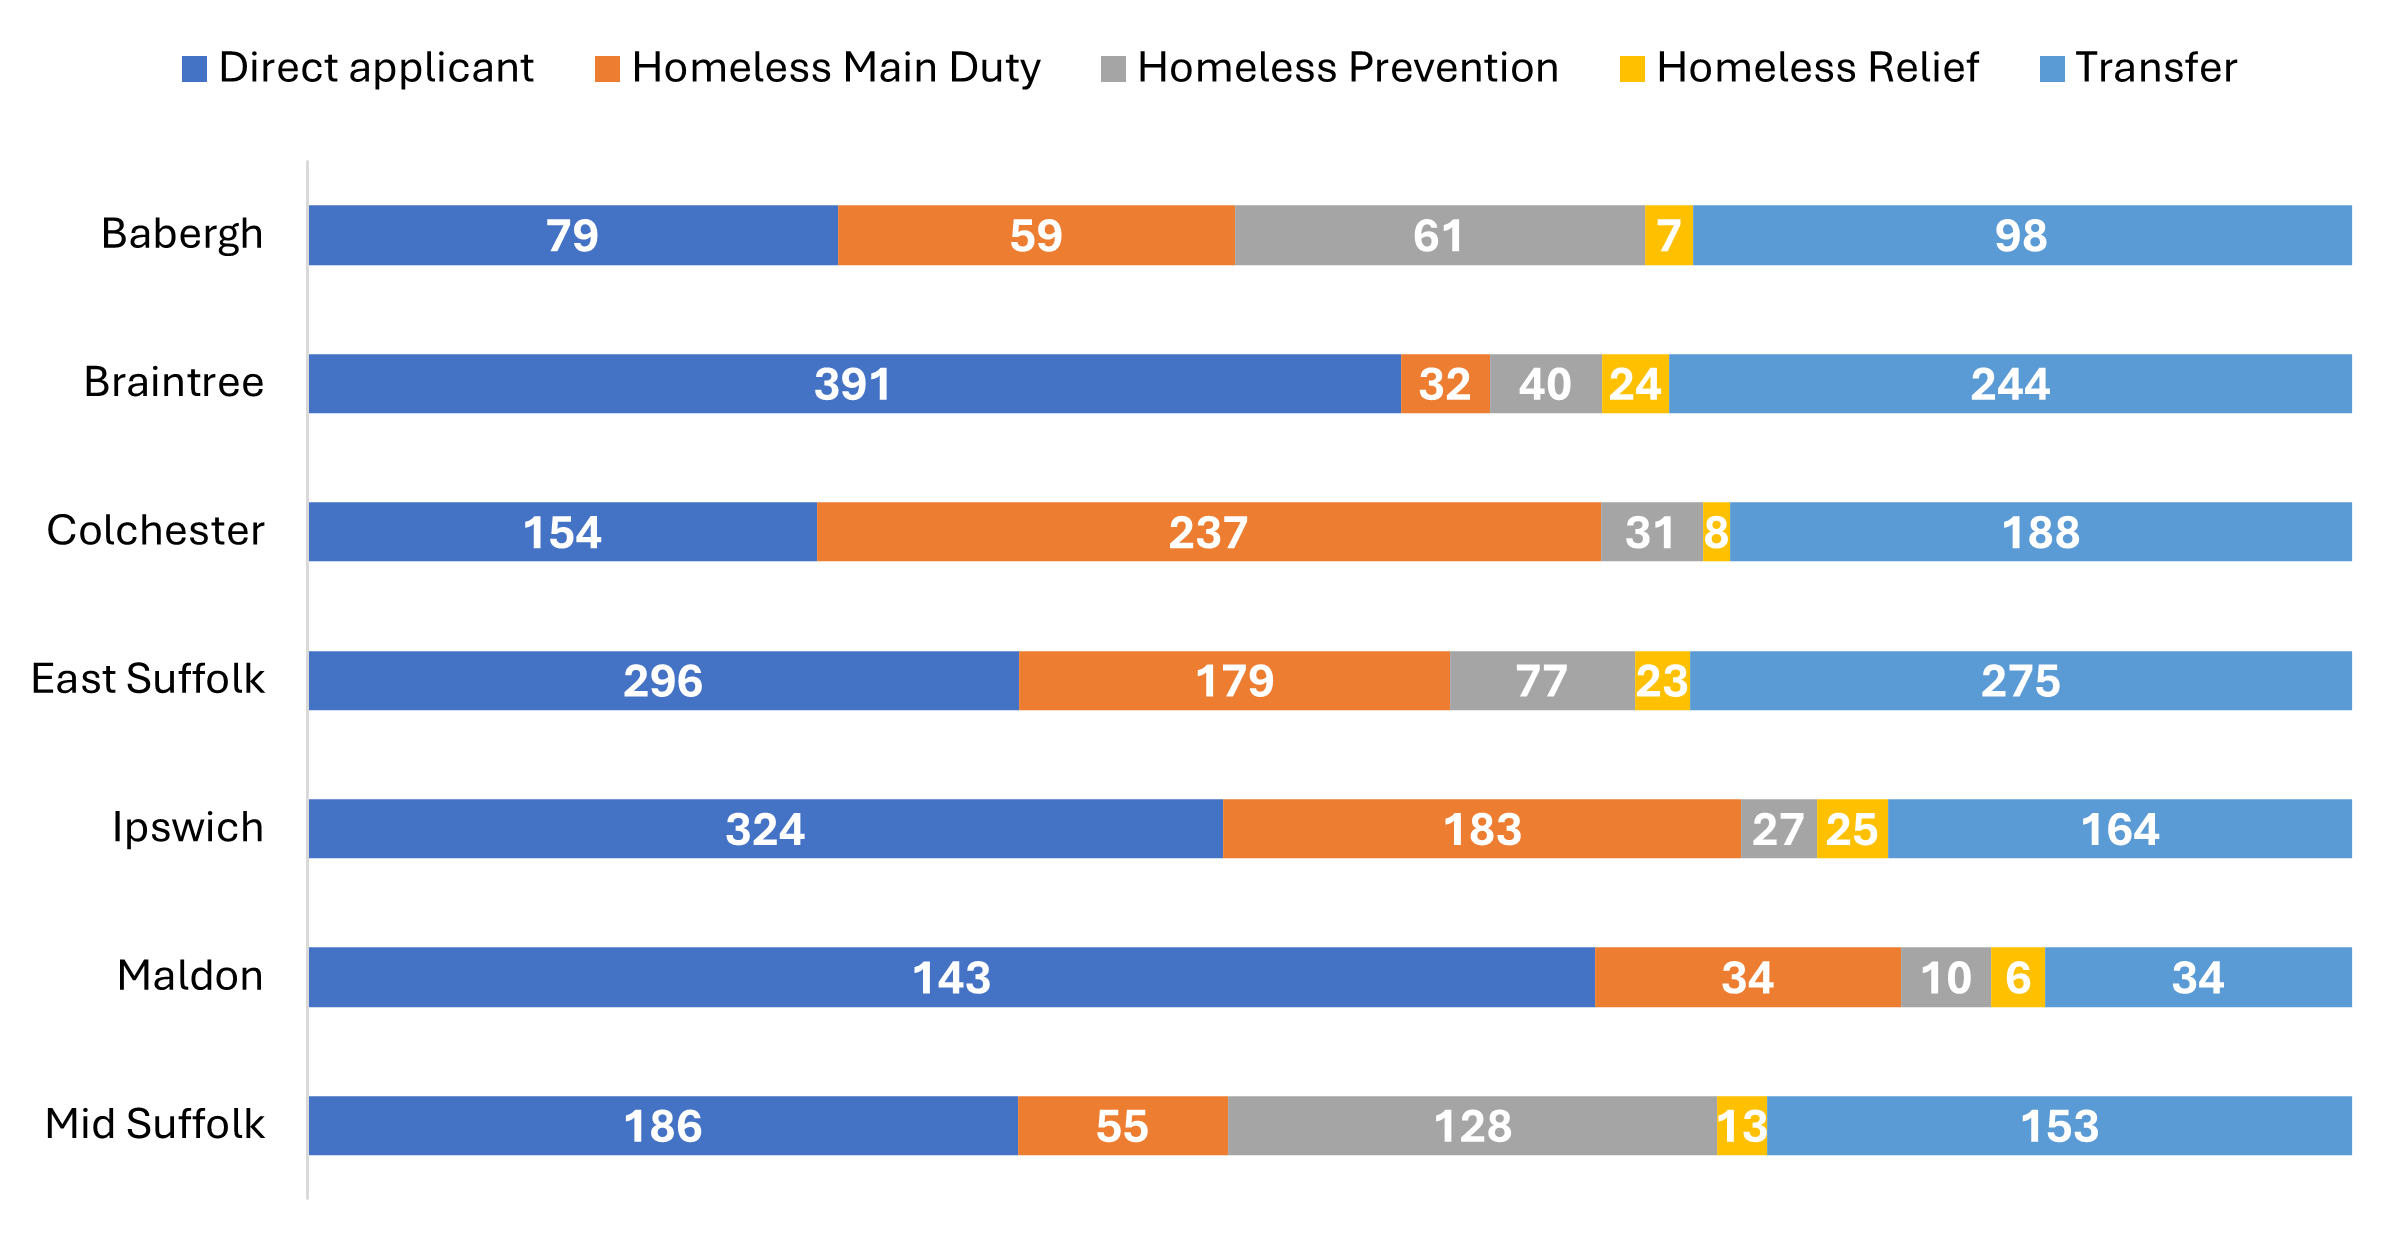
Applicants are split into five categories:
- Transfer applicants - are those who are existing tenants of a council or housing association property within the Gateway area of operation
- Homeless Prevention applicants – these are applicants to whom one of the POs owes the prevention duty under the Homelessness Reduction Act 2017
- Homeless Relief applicants – these are applicants to whom one of the POs owes the relief duty as stated in the Homelessness Reduction Act 2017
- Homeless main duty applicants – these are applicants to whom one of the POs owes the main housing duty under Part VII of the Housing Act 1996, as amended by the Homelessness Act 2002 and the Homelessness Reduction Act 2017
- Direct applicants - all other applicants
Partner Local Authorities want to house a reasonable balance between these groups. The scheme is designed to recognise how urgently people need to move while meeting legal duties and promoting a reasonable flow of properties.
7. Applicants housed in 2025 - 26 through Gateway to Homechoice split by applicant type
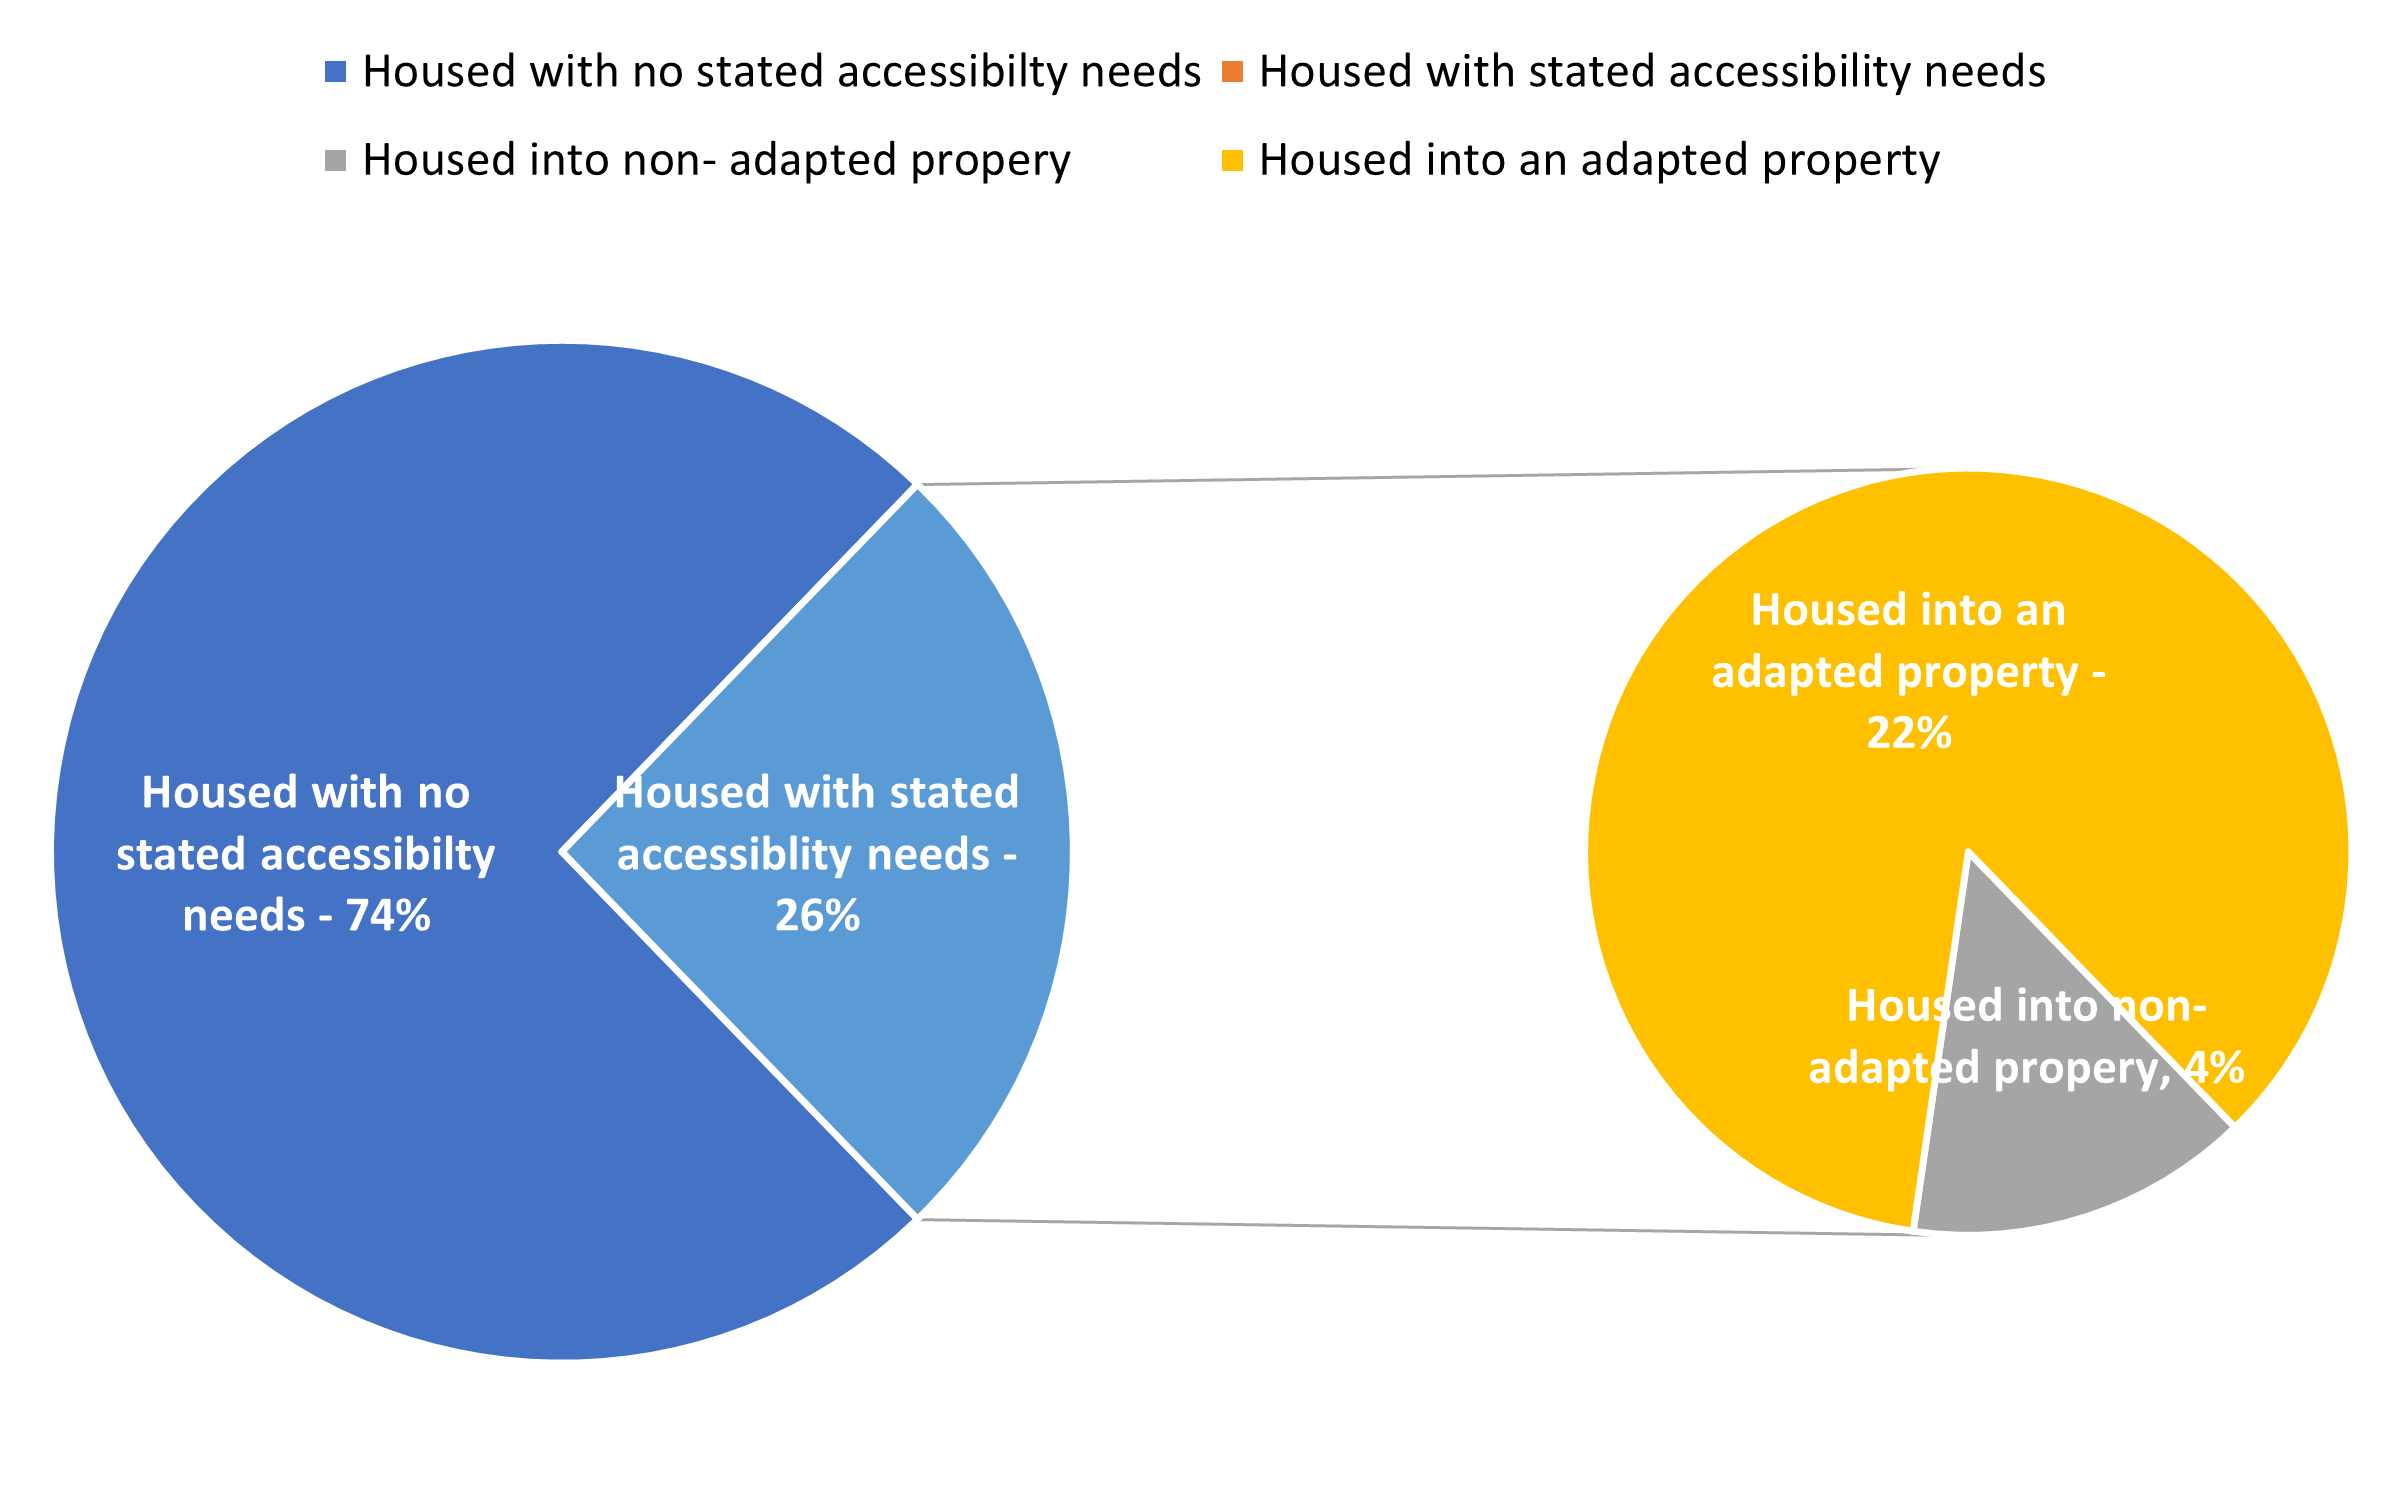
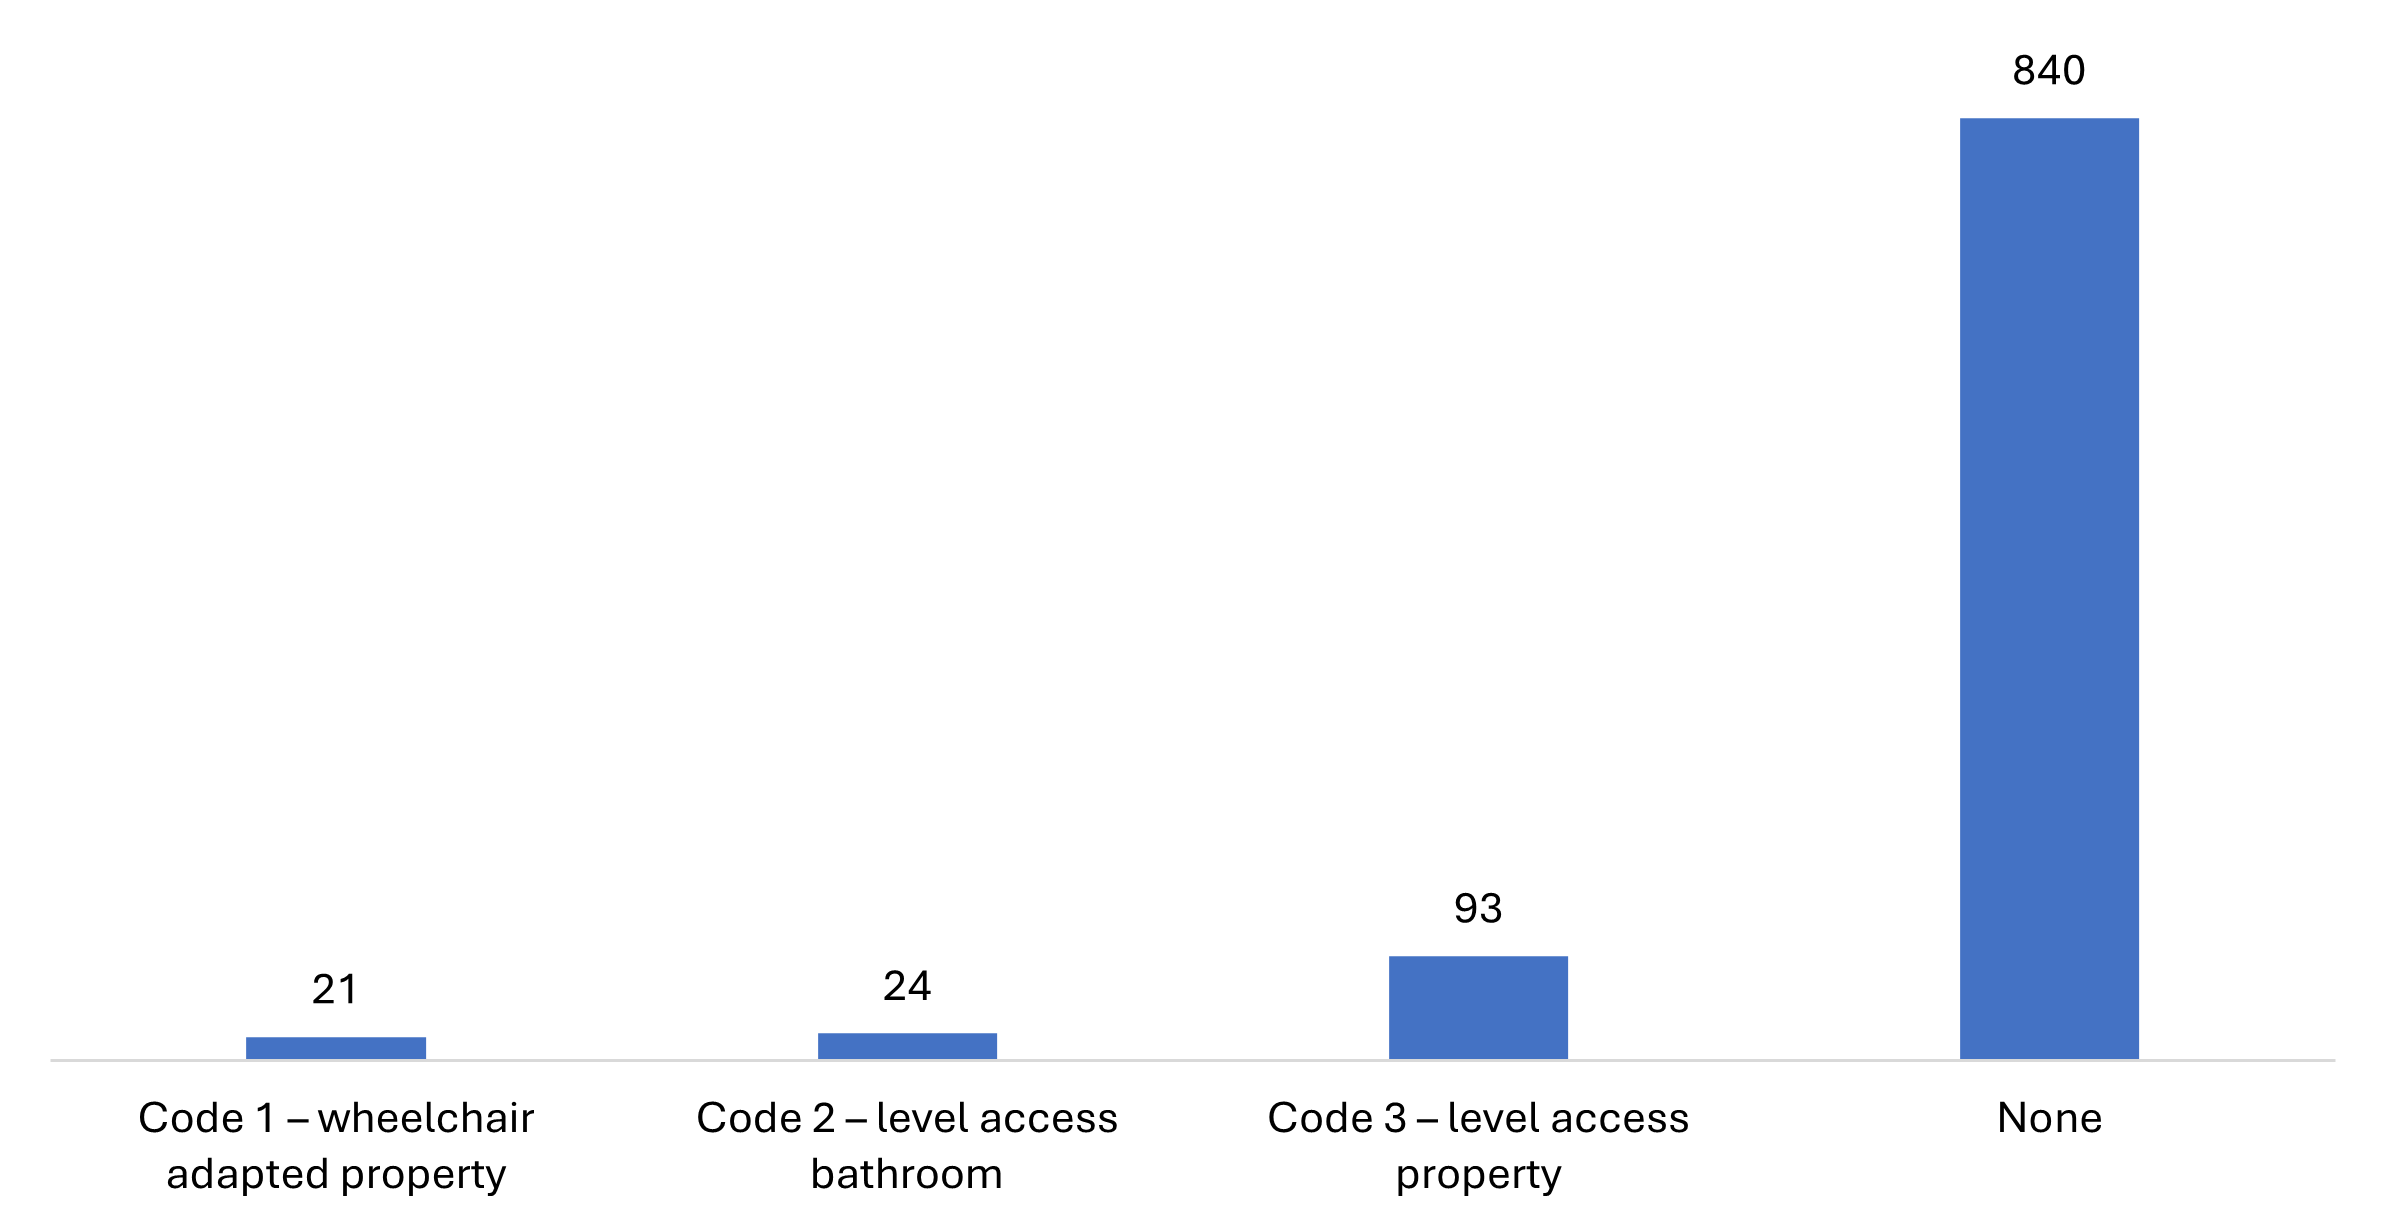
Accessibility and Adaptations
Some people with disabilities need a home to have certain features for it to be suitable for them. Most commonly, people have limited mobility and need a property with level access (such as a bungalow or ground floor flat). It is also relatively common for people to need a level-access shower. A few people need a property adapted specifically for a wheelchair user.
Partners are committed to making sure that adapted homes are offered to people who need the adaptations in the property. We therefore operate a system where people identify their accessibility needs to us and if a suitable property becomes vacant, people needing the adaptations are given priority.
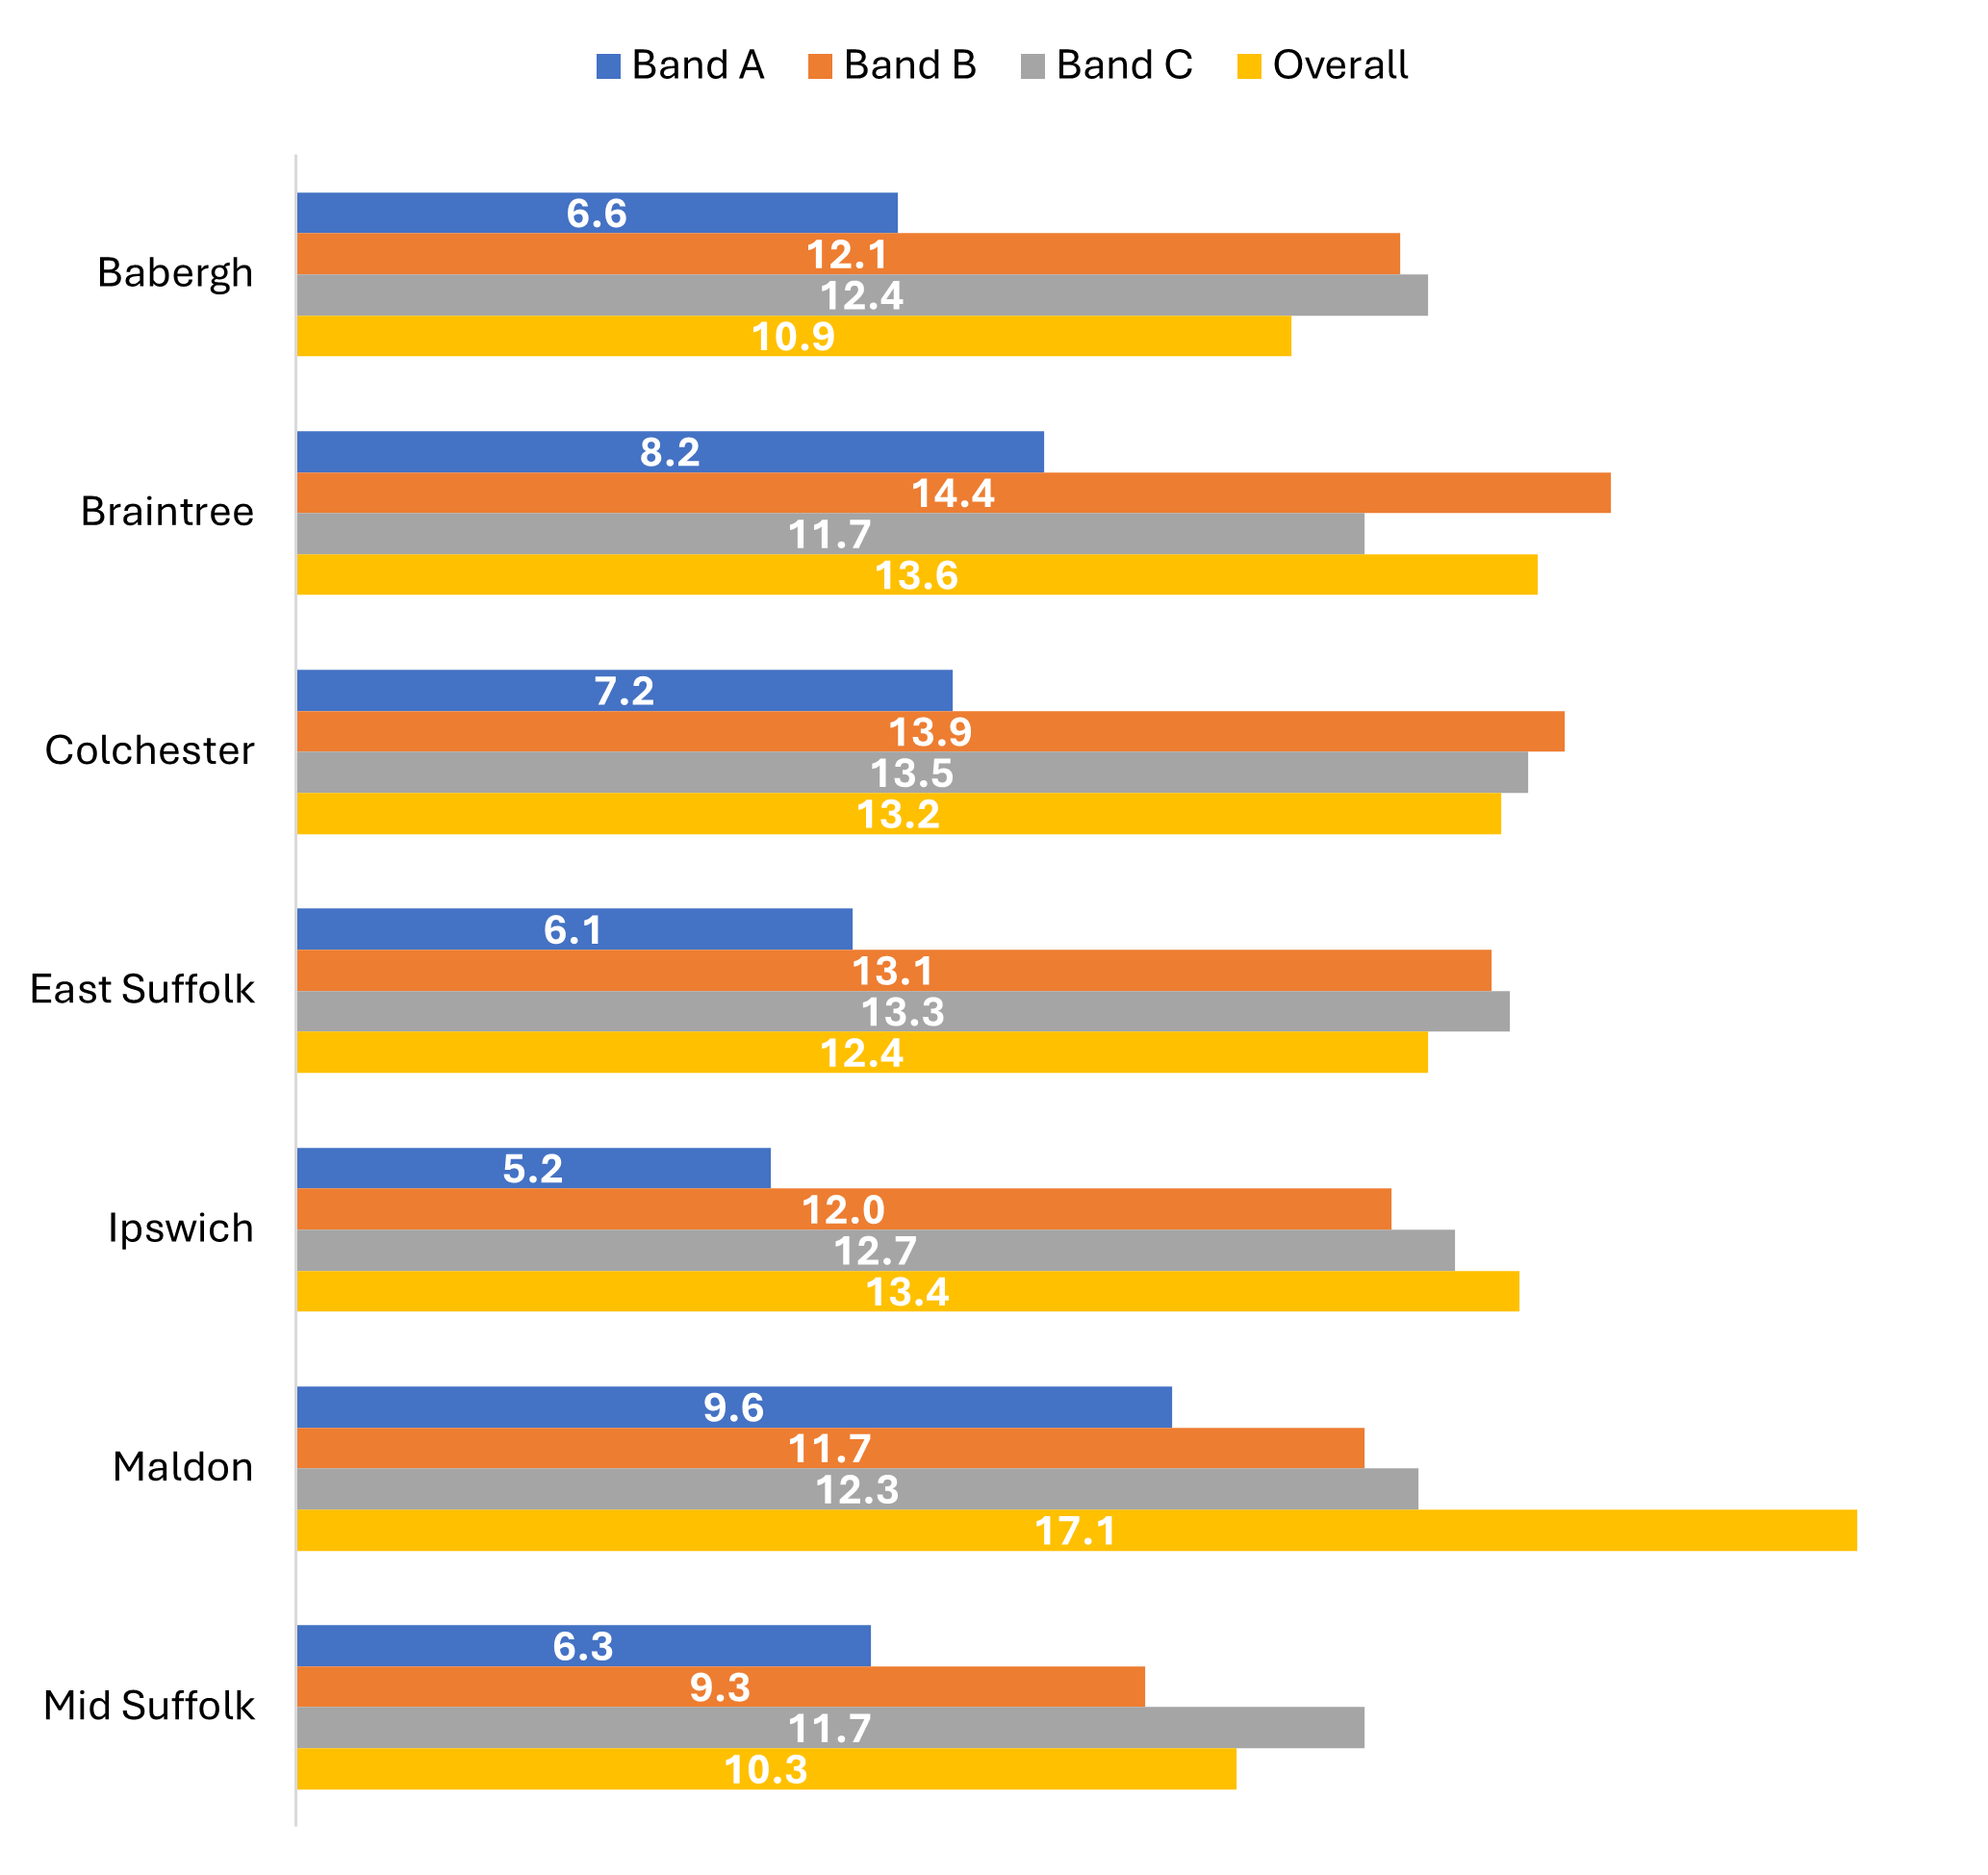
Waiting Times
The table below shows the typical waiting time (in months) for housing, broken down by the band of the applicant. It is measured by recording how long people have waited when they are housed.
We have excluded those housed applicants who were awarded a downsizing or Armed Forces priority as well as those who were housed in a property requiring a local connection. This is because in all three examples, the waiting times give a false impression to people using the waiting times as a guide to how quickly they could be housed. The reasons for this are as follows:
- Many people who are downsizing wait for a suitable property to become available in the area of their choice. Their waiting times are therefore longer than average.
- The higher priority for people who have served in the Armed Forces is given to reduce their waiting time. The scheme therefore distorts the data for people who have no such priority.
- Housing schemes (mainly in villages) requiring a local connection are often let to people in lower bands and with short waiting times.
By excluding these types of lettings before calculating the average waiting times, the results are much more representative of people’s experience of waiting times. The following data shows the typical waiting times for people by local authority and by Band.
9. 2025 - 26 Waiting times by Band (in months)
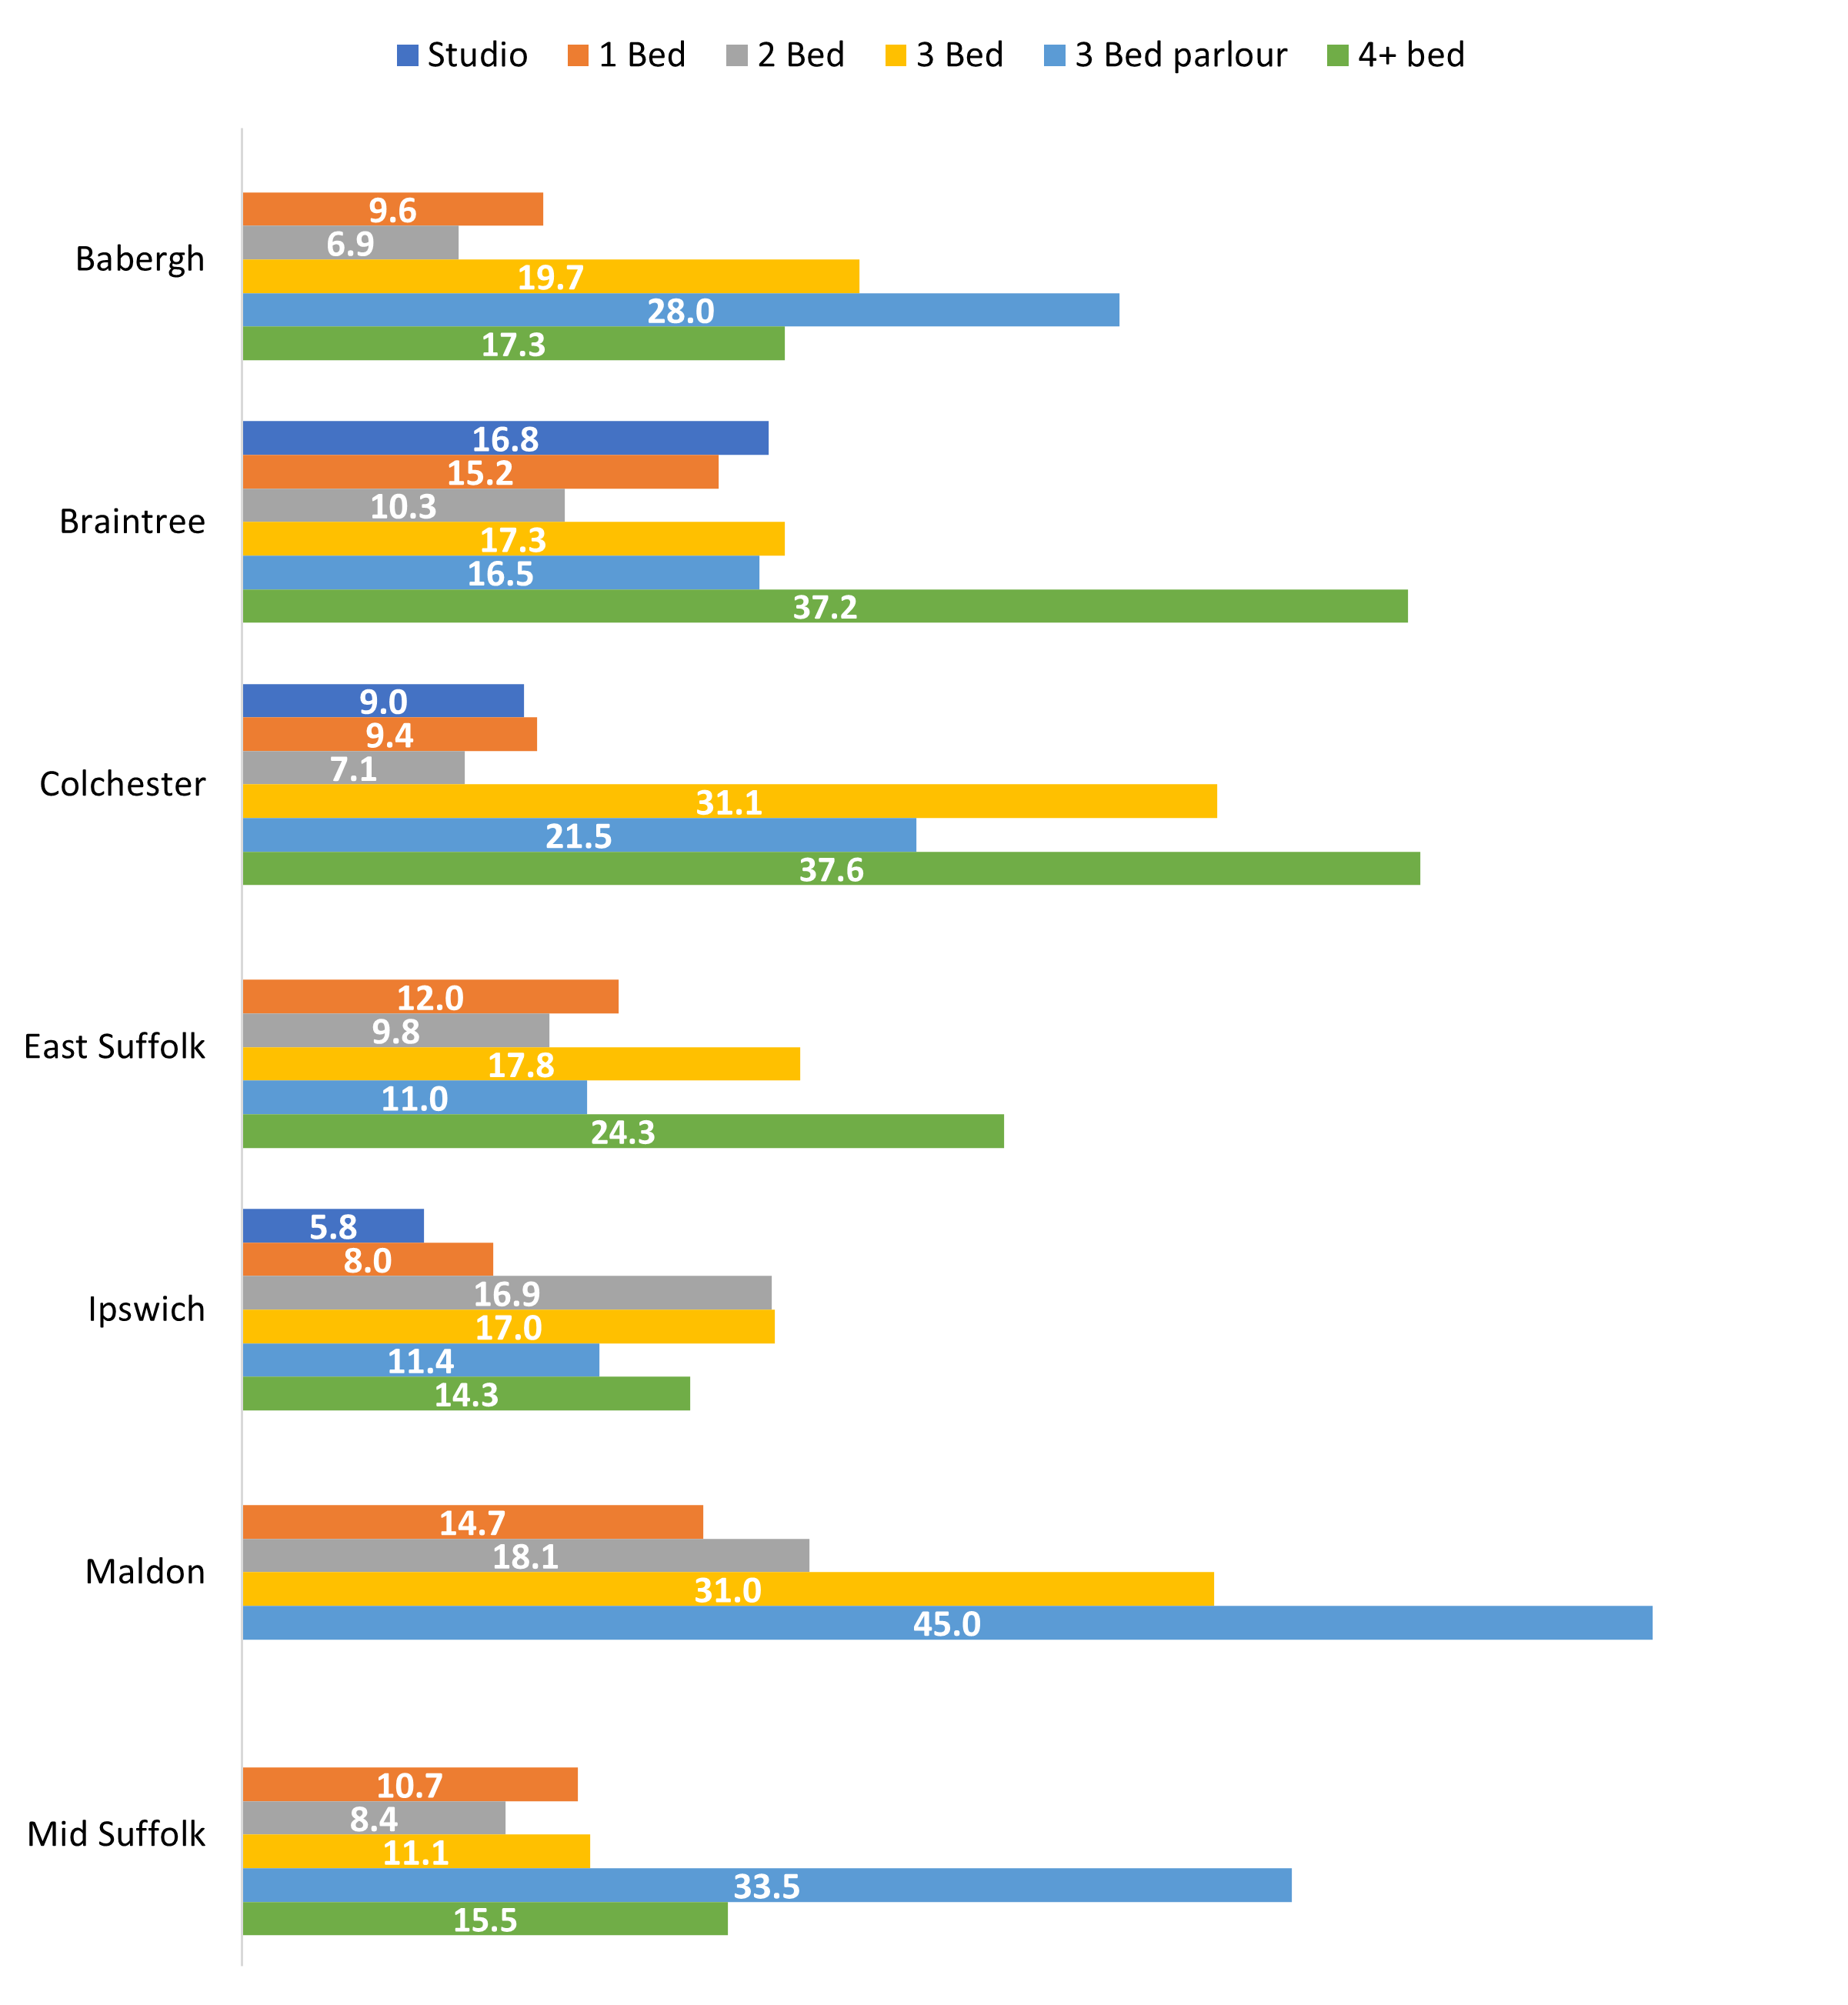
9a. 2025 - 26 Waiting times by bedroom size (in months)
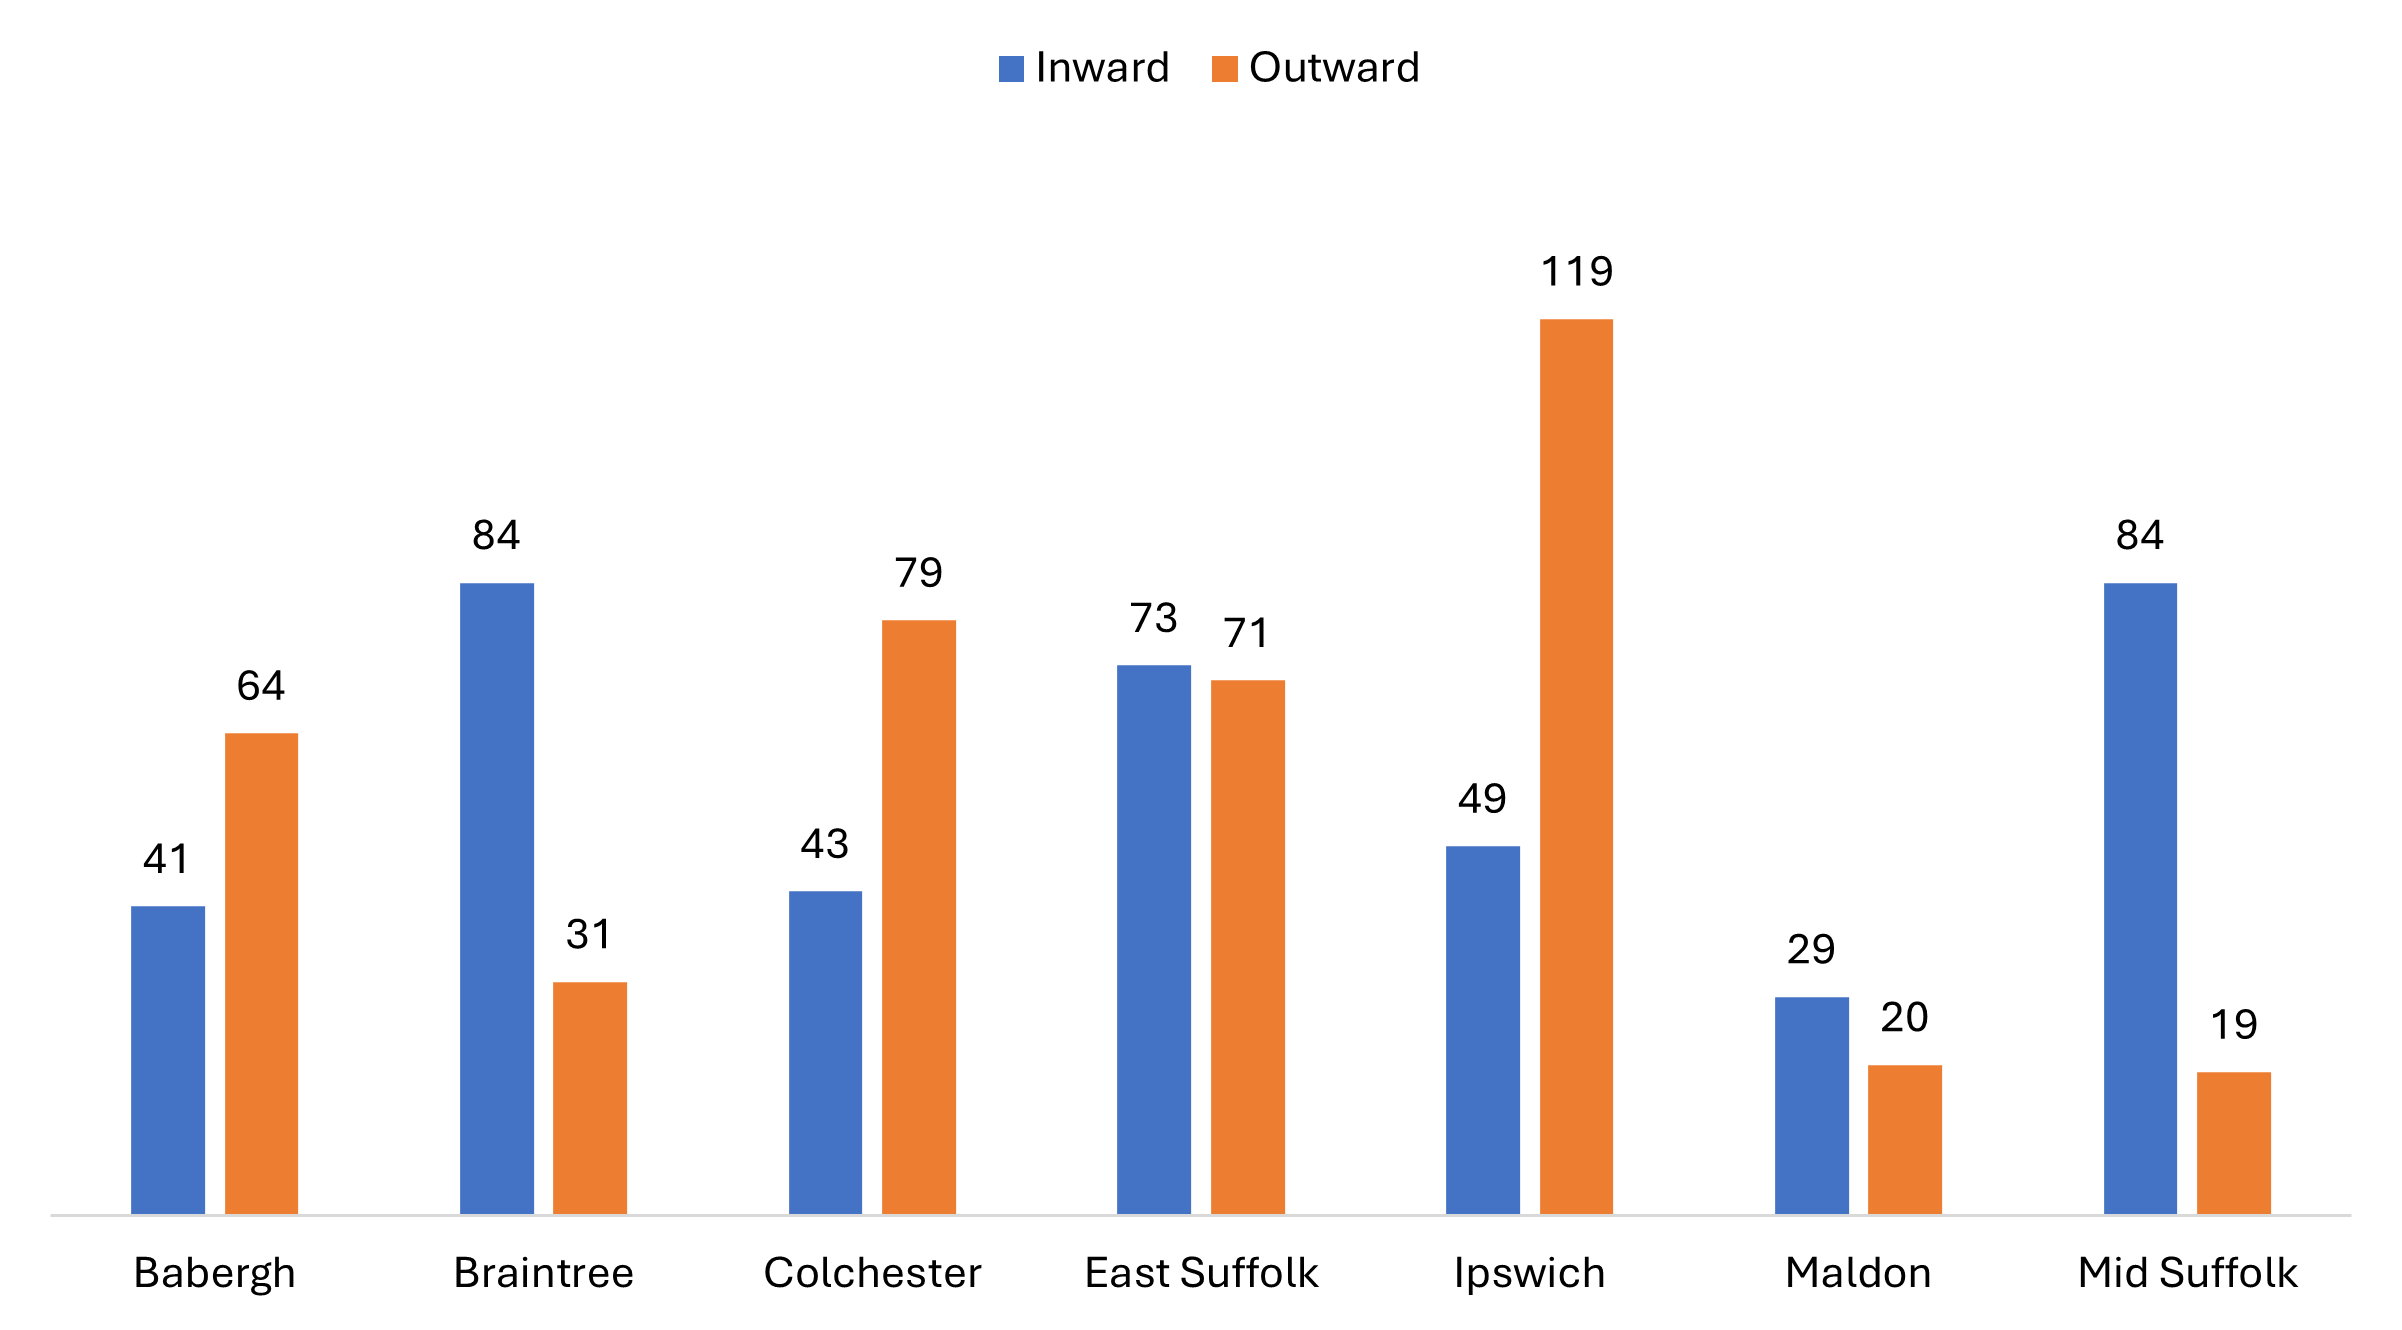
Household Movement
Households register with the district where they live (or where they want to live if they are from outside the area of the scheme). Once registered, they can ‘bid’ for housing in any of the 7 local authority areas, where they have a verified local connection and occasionally, in the other areas too, as a small percentage of properties in each are open to bids from all applicants.
There are some exceptions to this policy. In particular:
- If a Council accepts a homeless duty to an applicant, the applicant will normally be restricted to bidding for housing in the area of that Council.
- New affordable housing is normally offered on first let to people with a connection to the local authority where it is built. On some rural sites, where there are s106 agreements, the local connection also applies each time they are re-let.
Imbalances between inward and outward movement can be controlled by advertising properties as available only for local residents for a period of time. This can be applied to specific property types, for example to 2 bedroom houses, so that a Council can restrict bidding until a better balance is reached.
The following tables show the extent of cross-boundary movement between the Local Authorities. The majority of the people who move between districts have a connection (for example through work or family) to the area they move to.
10. The movement of households housed through Gateway to Homechoice in 2025 - 26
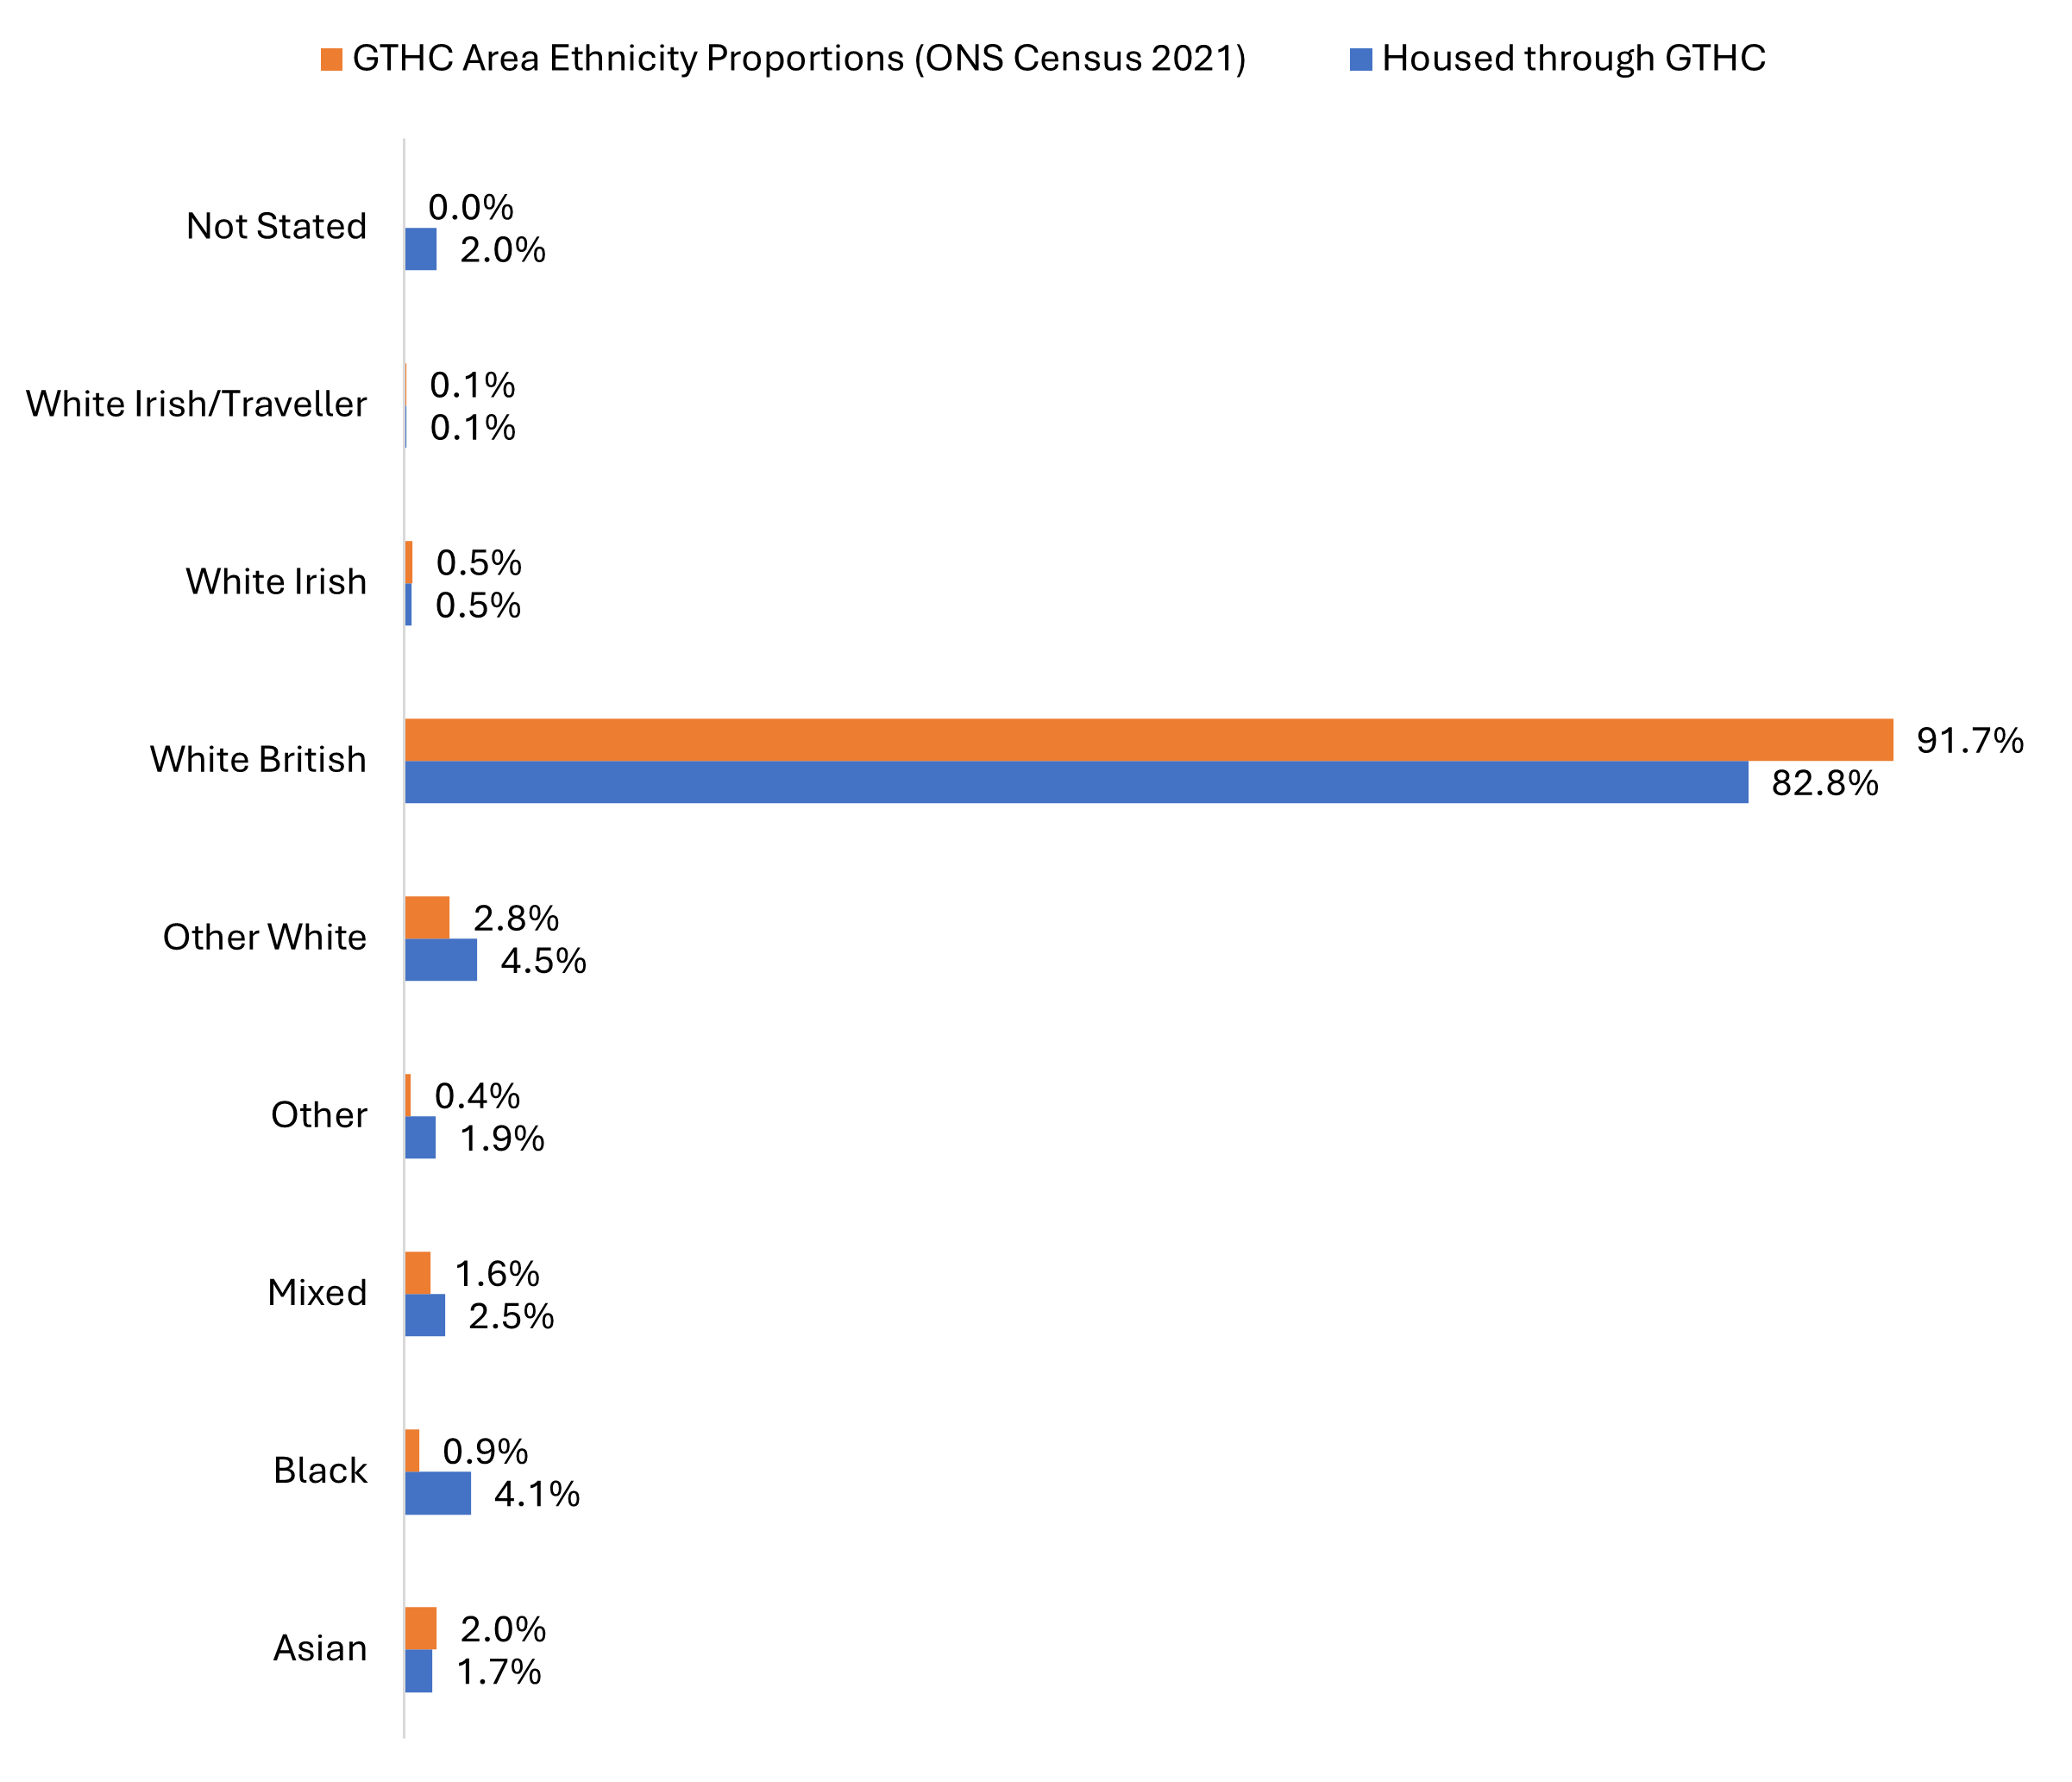
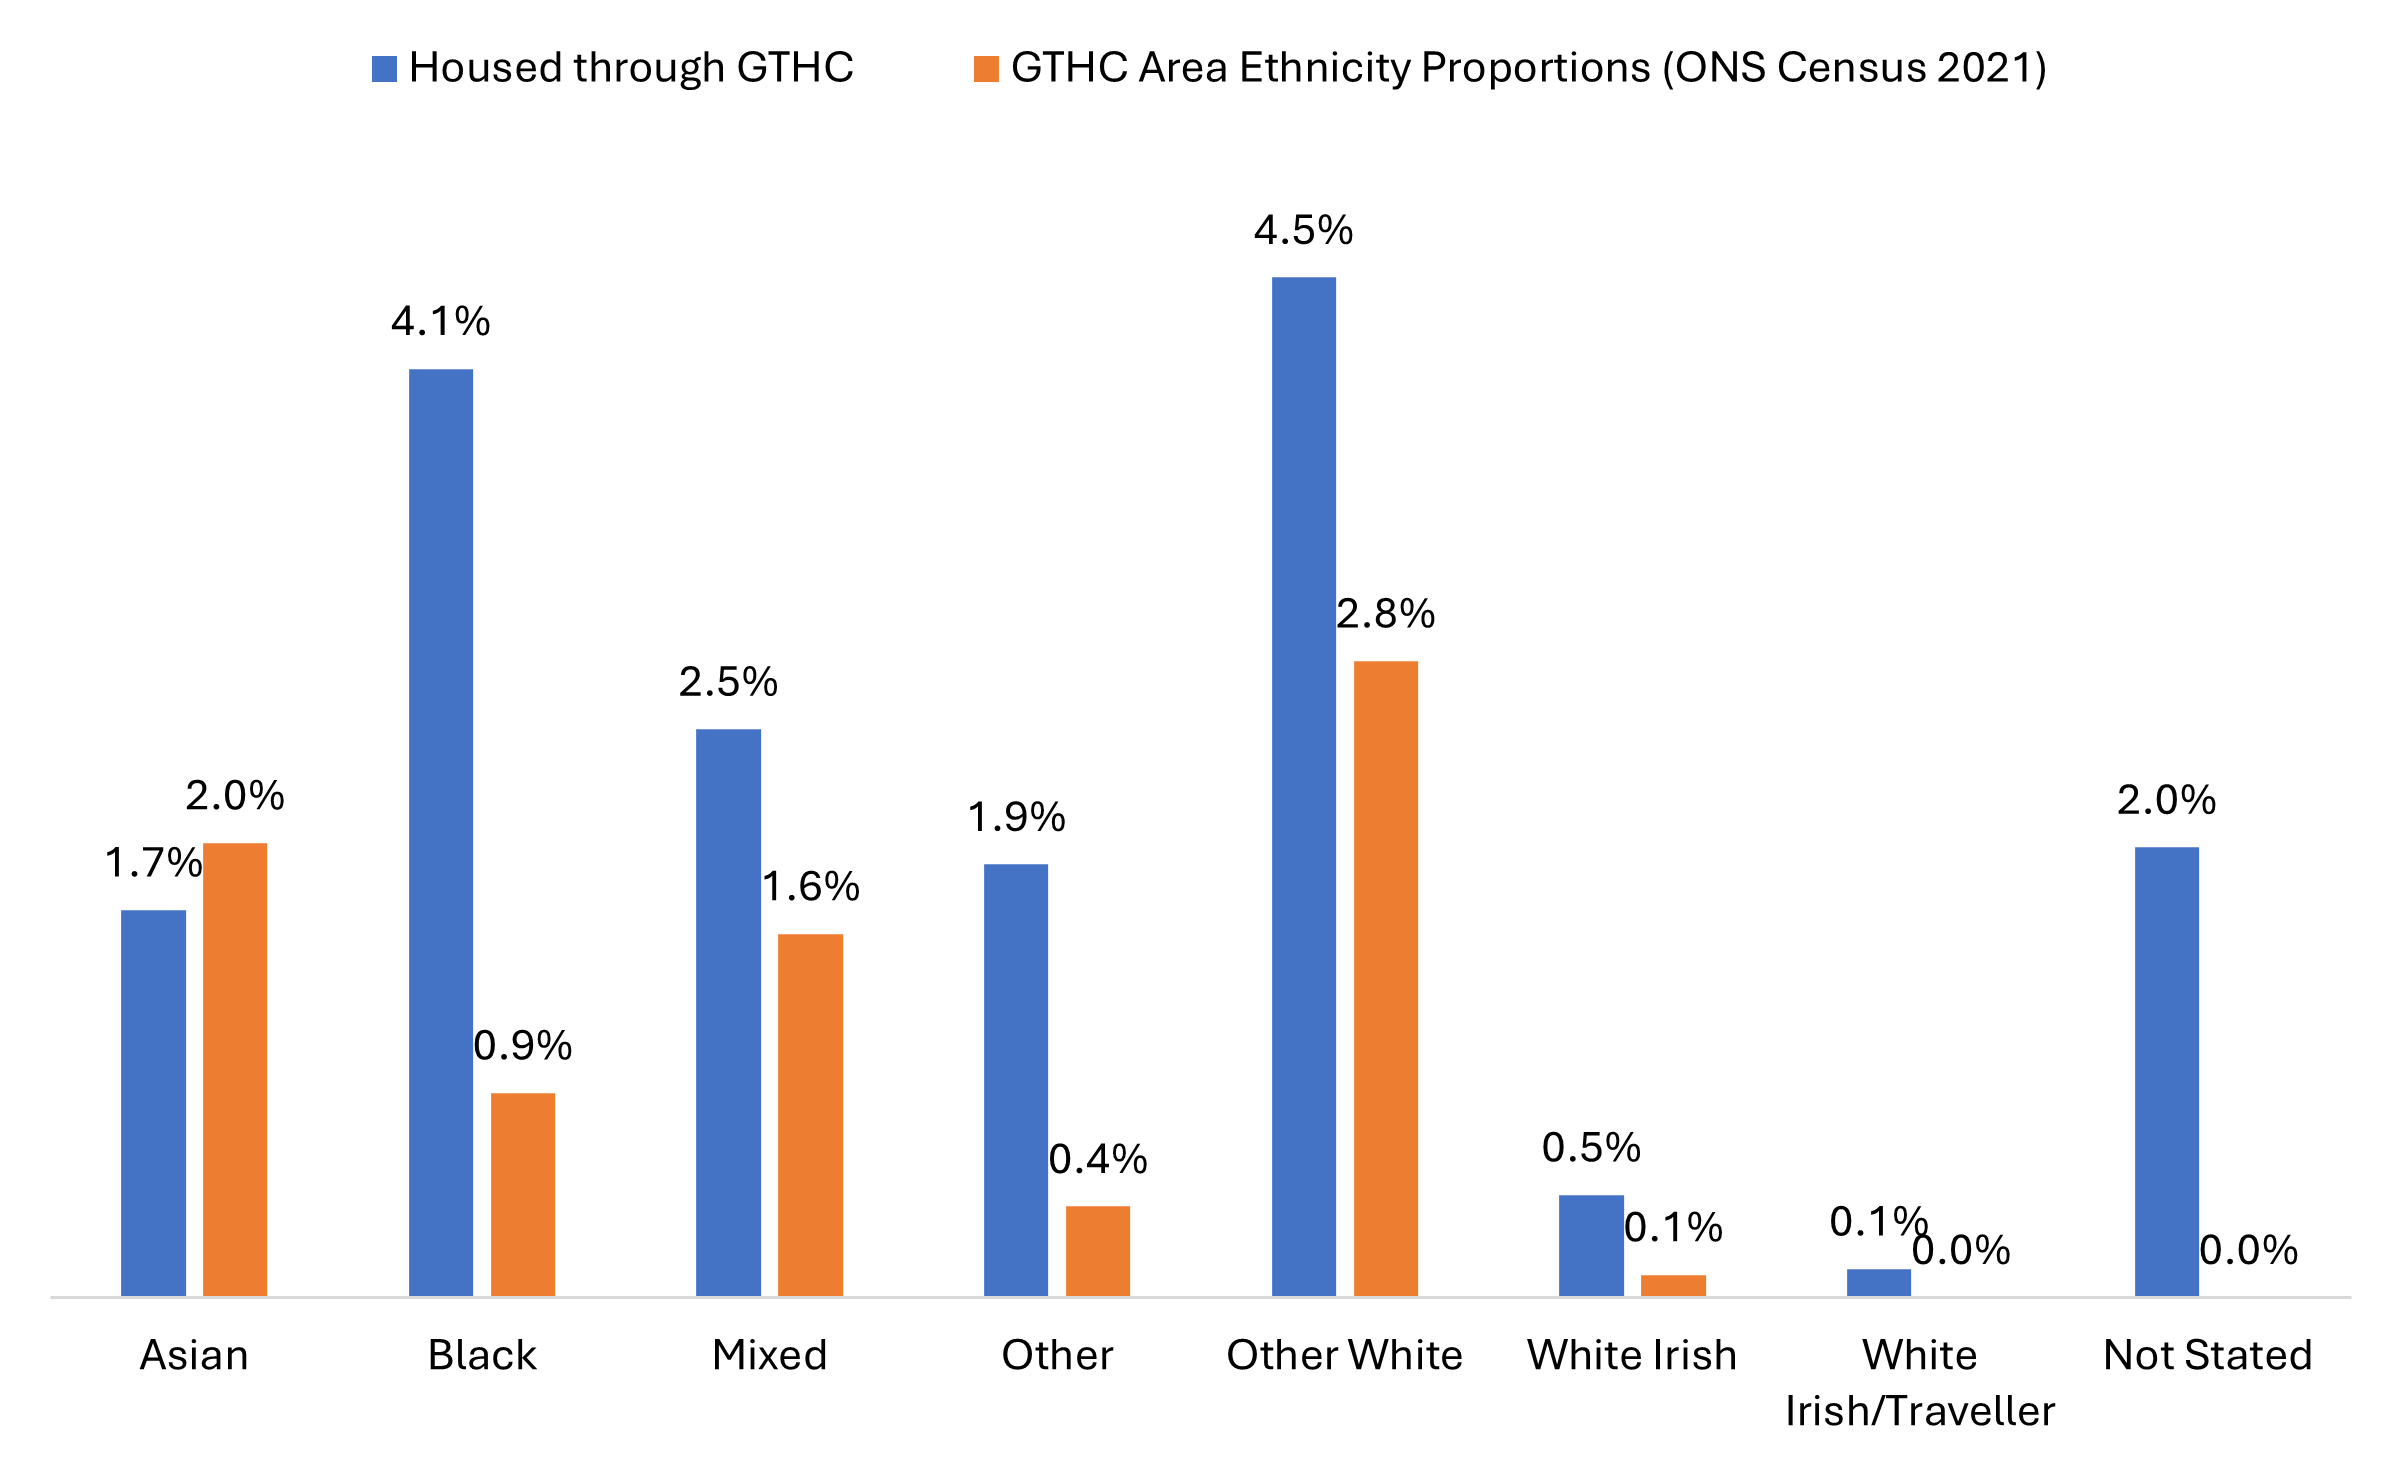
11a. As above, but with the ‘White British’ ethnic group excluded.
12. Gateway to Homechoice Armed Forces data
In accordance with The Allocation of Housing (Qualification Criteria for Armed Forces) (England) Regulations 2012 and Statutory guidance issued in 2024, the Allocations Policy awards additional priority to people who have served in the Armed Forces.
Currently, when a Gateway local authority considers an application from someone who has a history of service, they use the same criteria as when they band all other applicants. When households bid for a property, those in Bands A – C, with a service history automatically come above all the people in the same Band who do not have a service history. This means they are more likely to be housed than someone who has the same circumstances but has no history of service.
|
Local authority |
Households housed with Armed Forces priority in 2025 - 26 |
Total households housed through GTHC in 2025 - 26 |
|
Babergh District Council |
6 |
304 |
|
Braintree District Council |
26 |
731 |
|
Colchester City Council |
17 |
618 |
|
East Suffolk Council |
11 |
850 |
|
Ipswich Borough Council |
11 |
724 |
|
Maldon District Council |
4 |
227 |
|
Mid Suffolk District Council |
7 |
535 |
|
Total |
82 |
3989 |
|
Overall % Housed |
2% |
100% |
|
Local authority |
Active Applicants with Armed Forces Priority as at April 2026 |
Total Active Applicants as of April 2026 |
|
Babergh District Council |
23 |
1124 |
|
Braintree District Council |
52 |
3081 |
|
Colchester City Council |
59 |
2544 |
|
East Suffolk Council |
52 |
4094 |
|
Ipswich Borough Council |
38 |
2832 |
|
Maldon District Council |
8 |
730 |
|
Mid Suffolk District Council |
27 |
968 |
|
Total |
259 |
15373 |
|
Overall % of Active Applicants |
1.7% |
100% |
|
Priority Type
|
Overall Average Waiting Time in Months to be housed through GTHC in 2025 - 26 |
| Households housed with Armed Forces Priority | 9.4 months |
| Households housed with no Armed Forces Priority | 13.1 months |
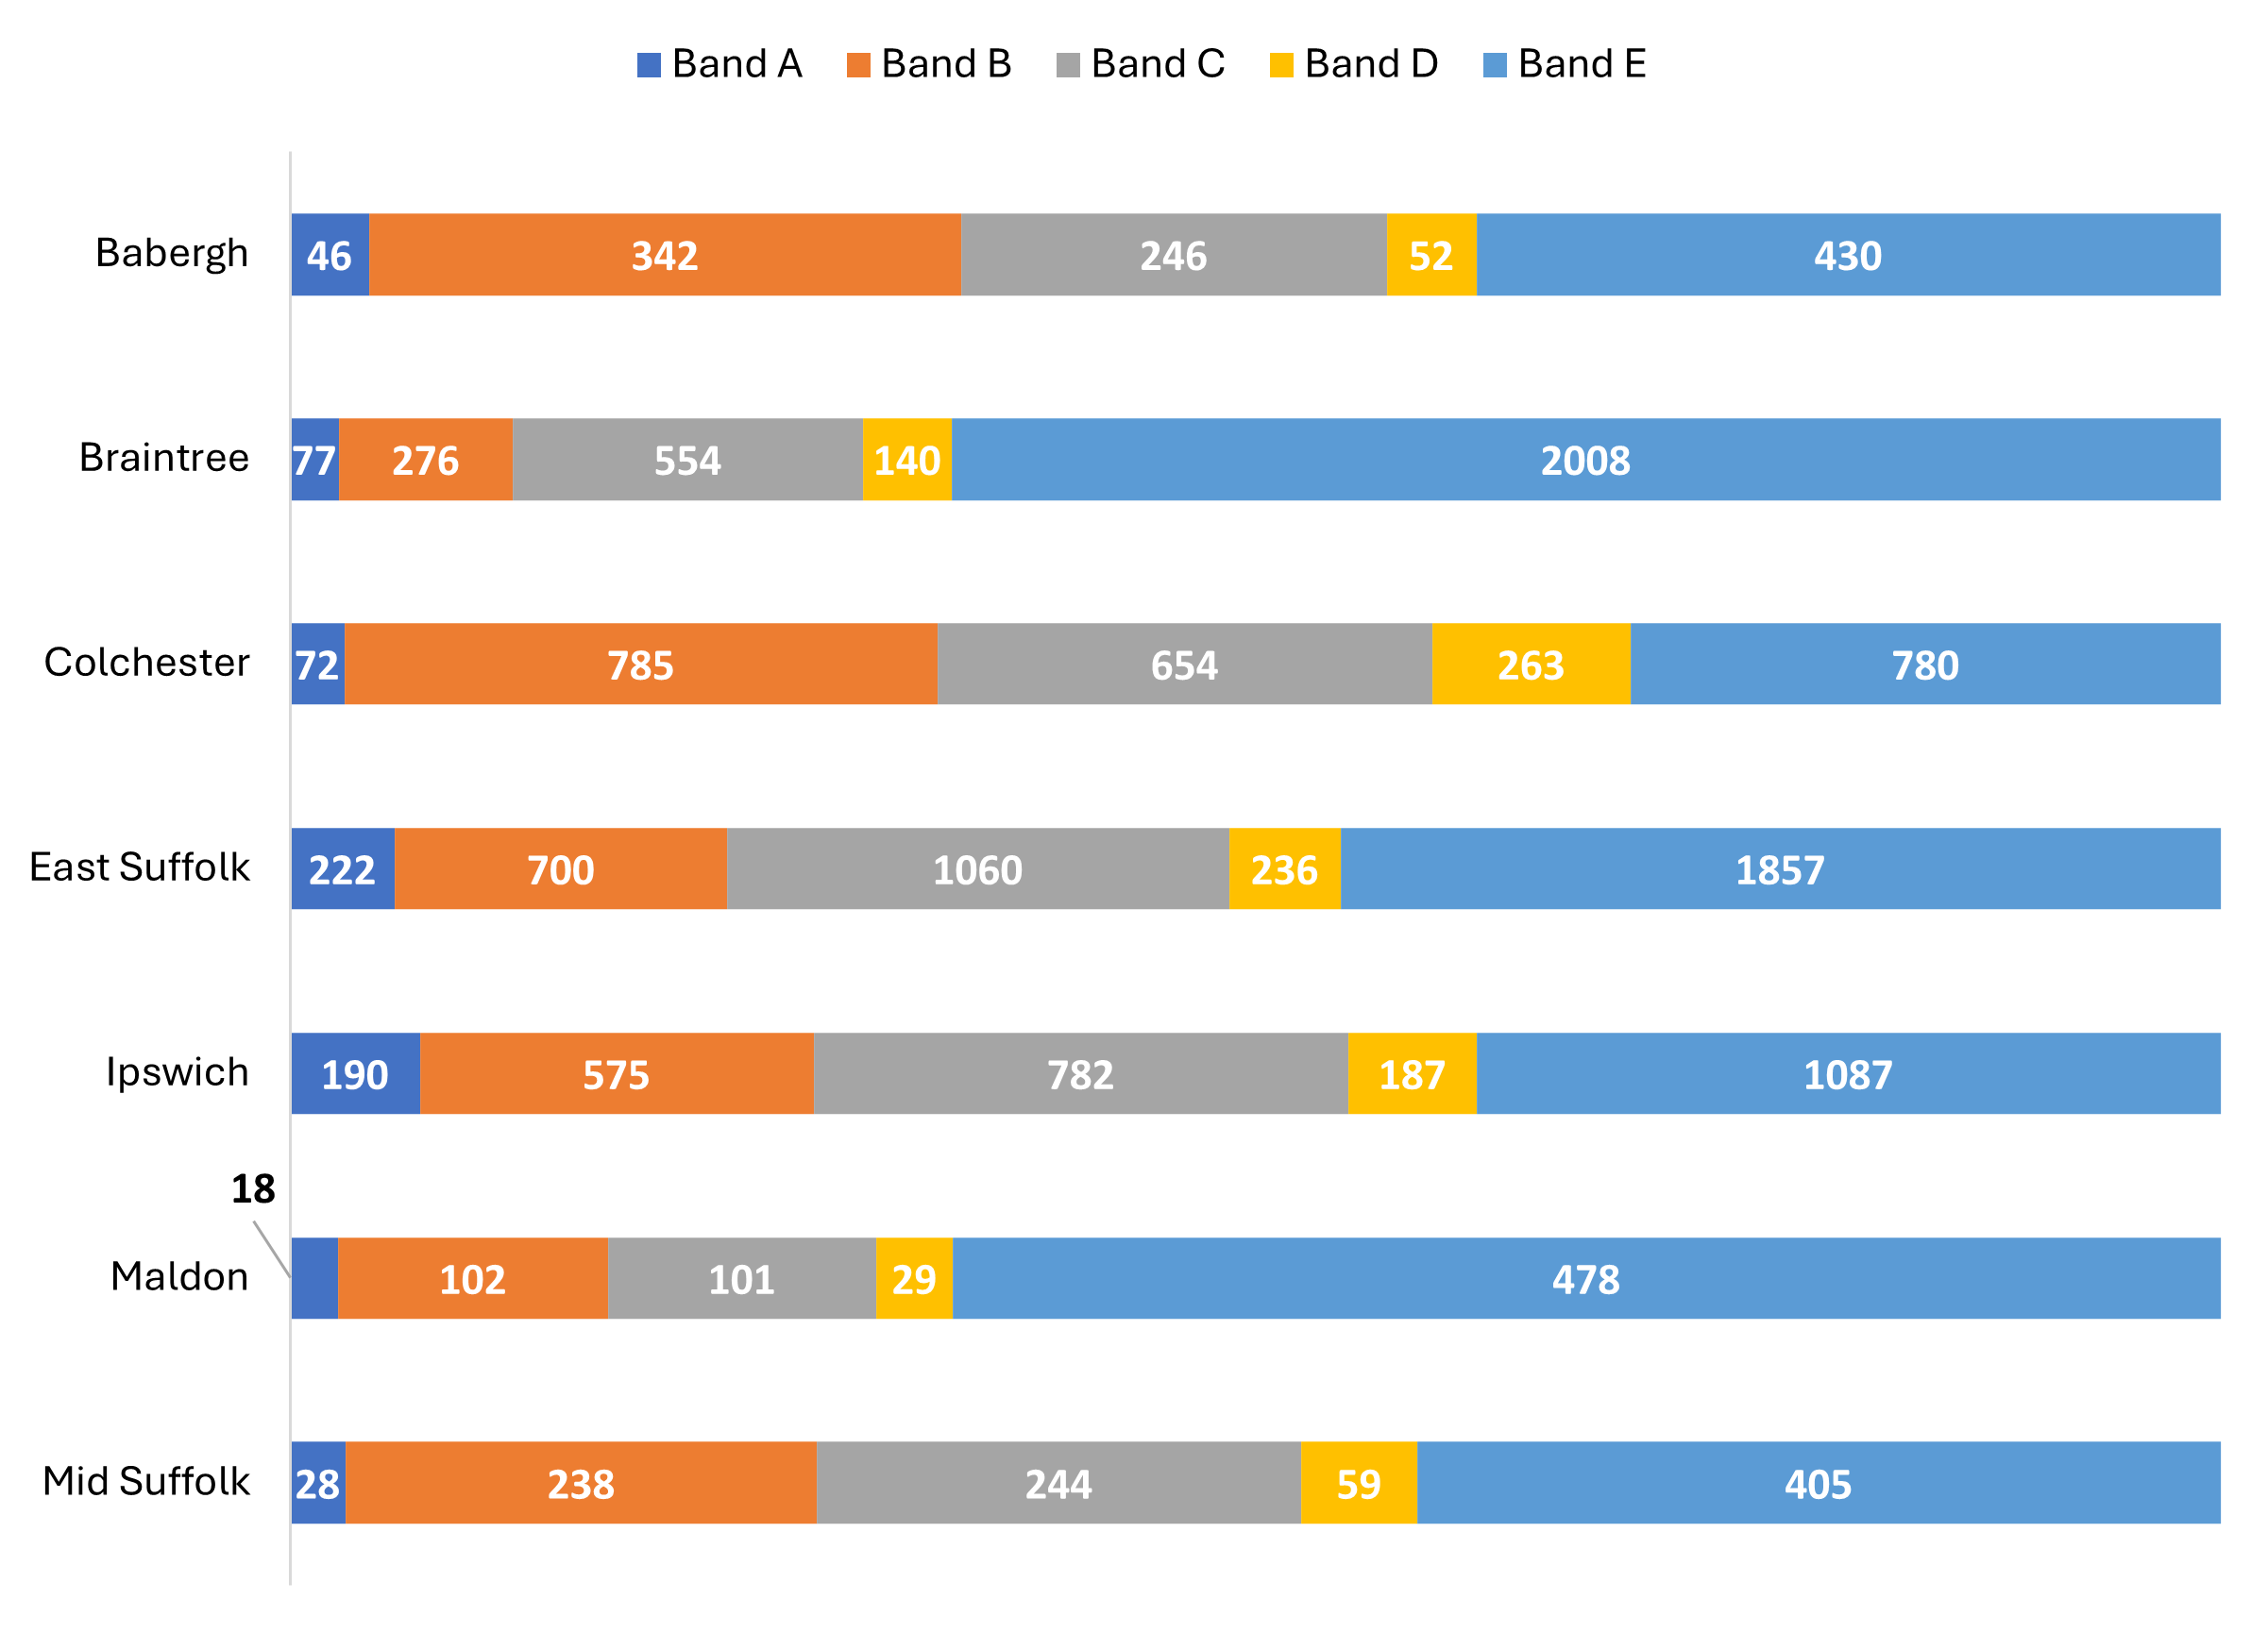
13. Gateway to Homechoice ‘Active Applicants’ data by Band as of 1st April 2026
The number of applicants changes all the time as new people register and households move into accommodation or do not renew their application. Applicant numbers are therefore a ‘snapshot’ at a particular point in time.
All of the data for the report so far has related to the households that have been housed through the scheme and mainly looks back at the year from 01 April 2025 to 31 March 2026. The data below relates to people waiting to be housed. The report from which this was generated was taken on 1st April 2026.
13.a The below shows the number in each Band, in each local authority.
13.b The chart below shows the proportion of active applicants to total population in each local authority area[1]
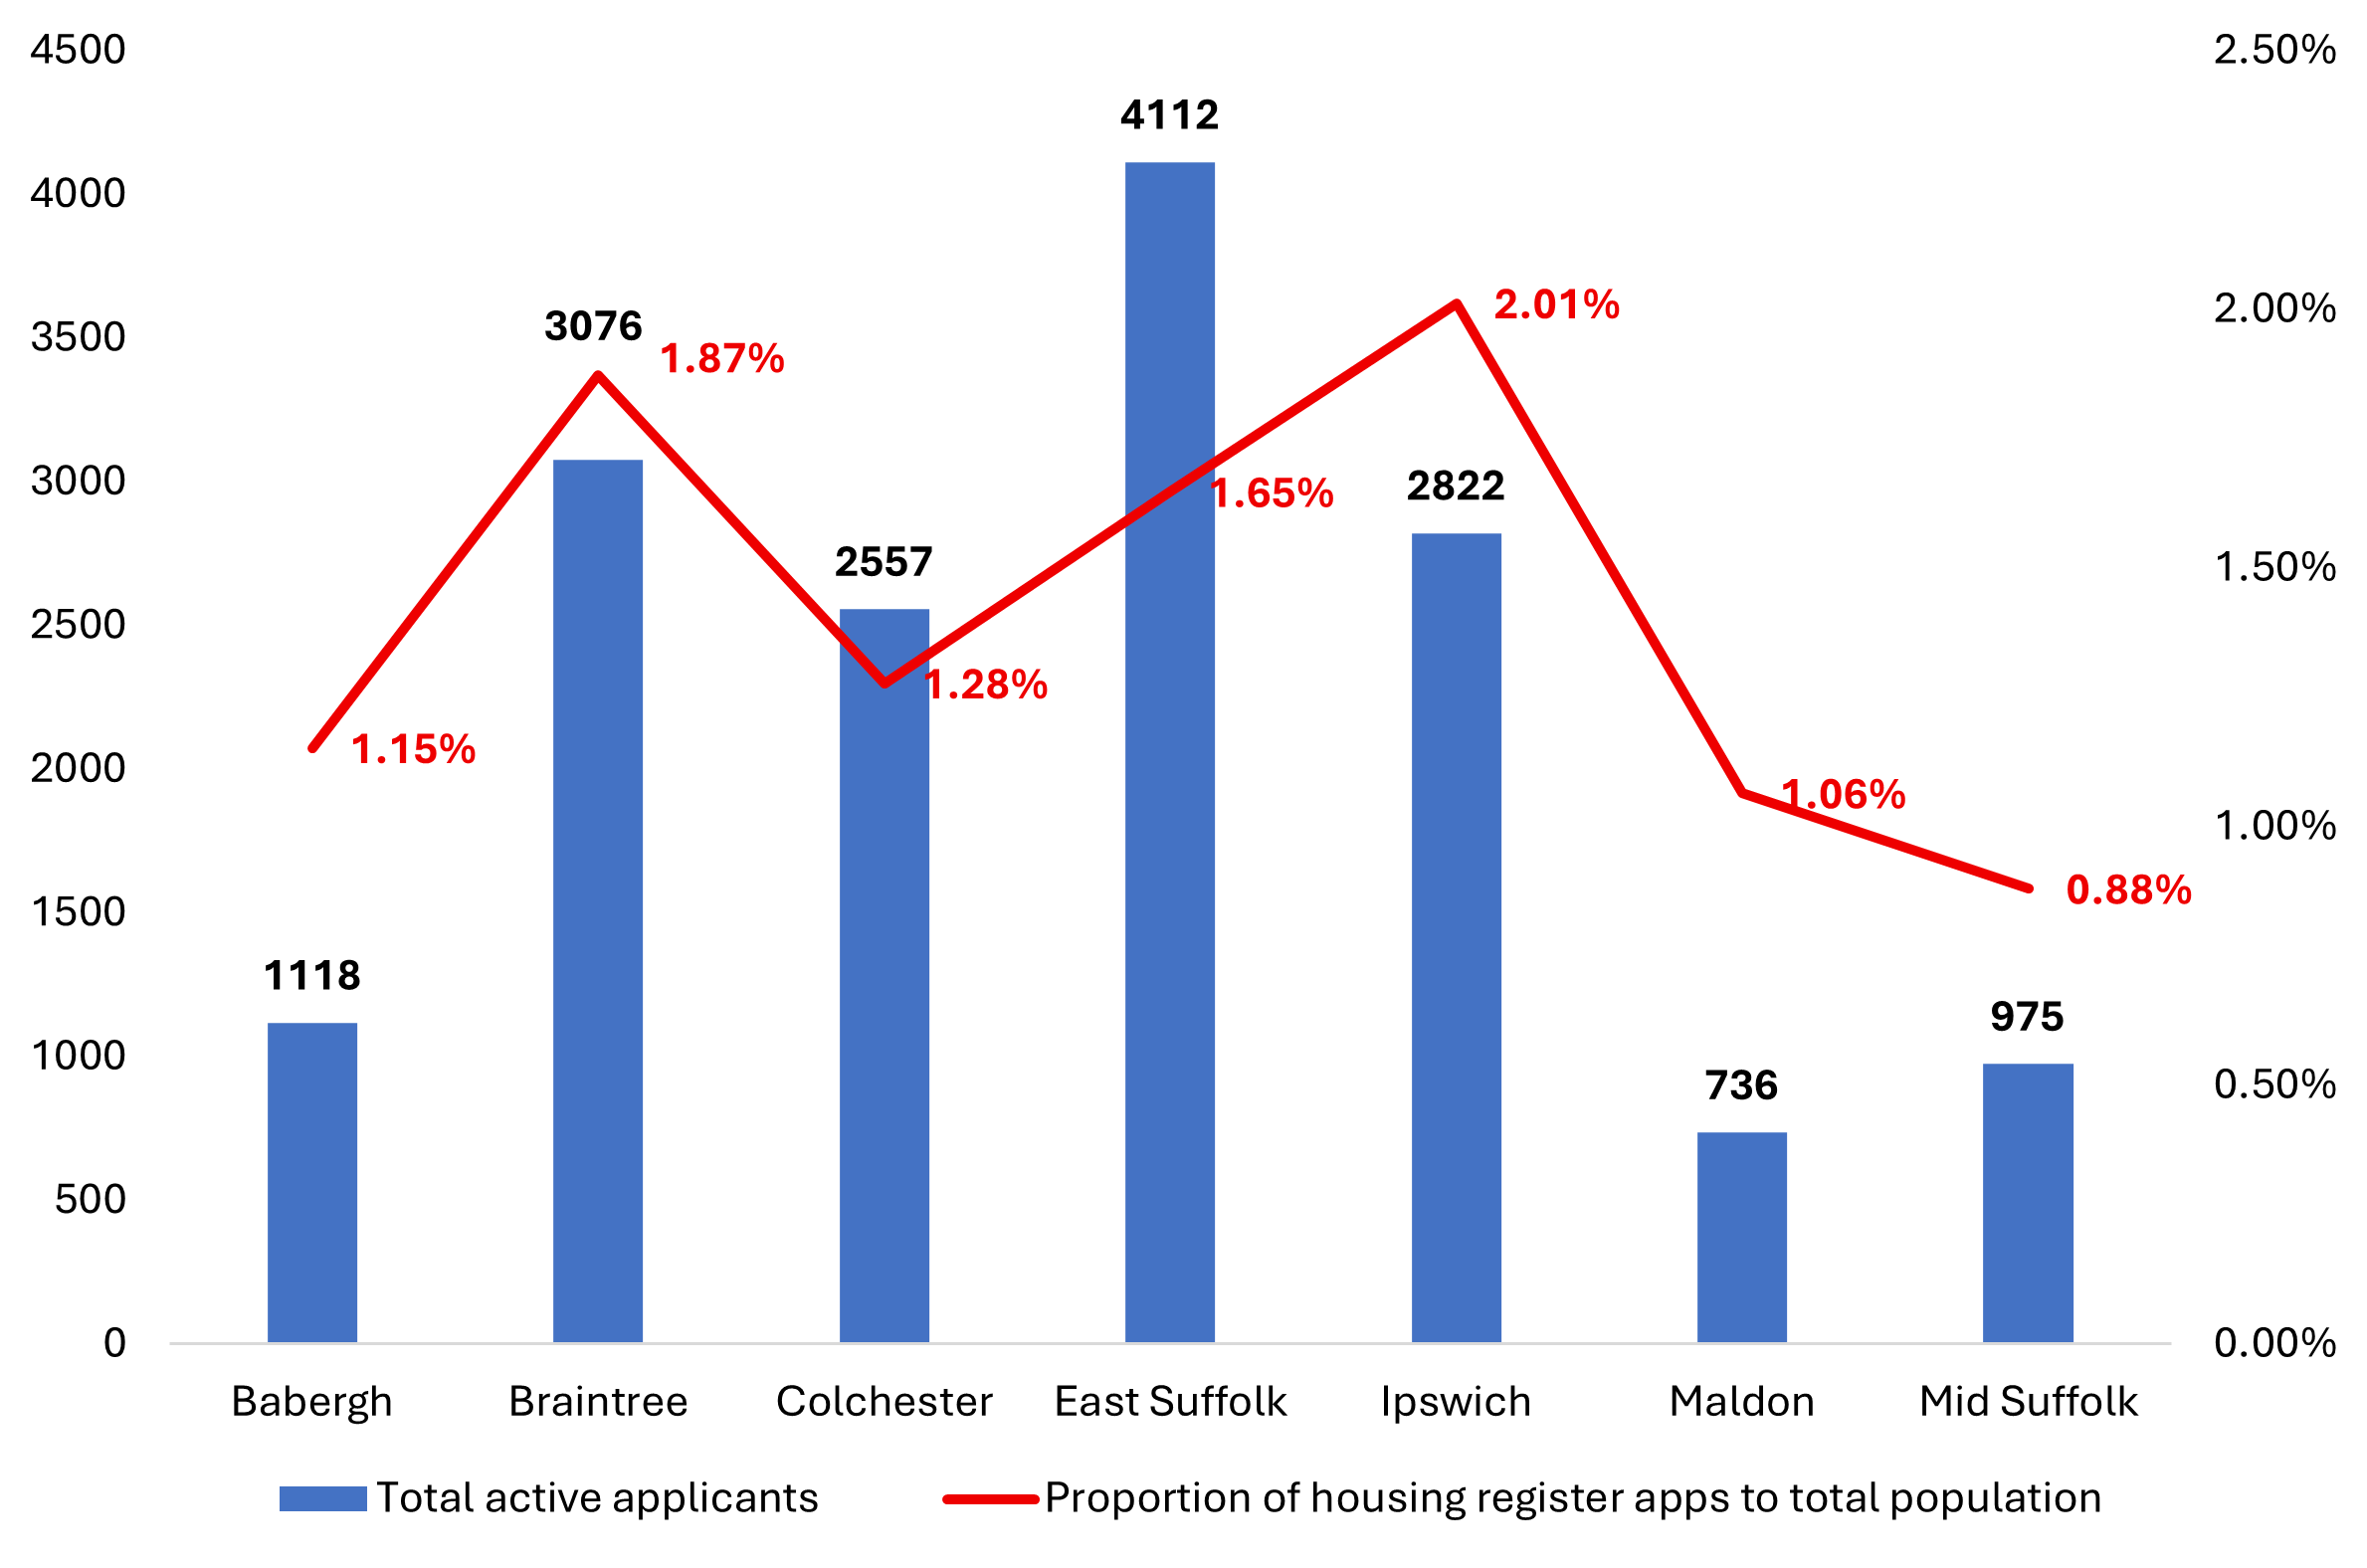
[1] Population estimates are available at the Office for National Statistics: Population estimates for England and Wales - Office for National Statistics
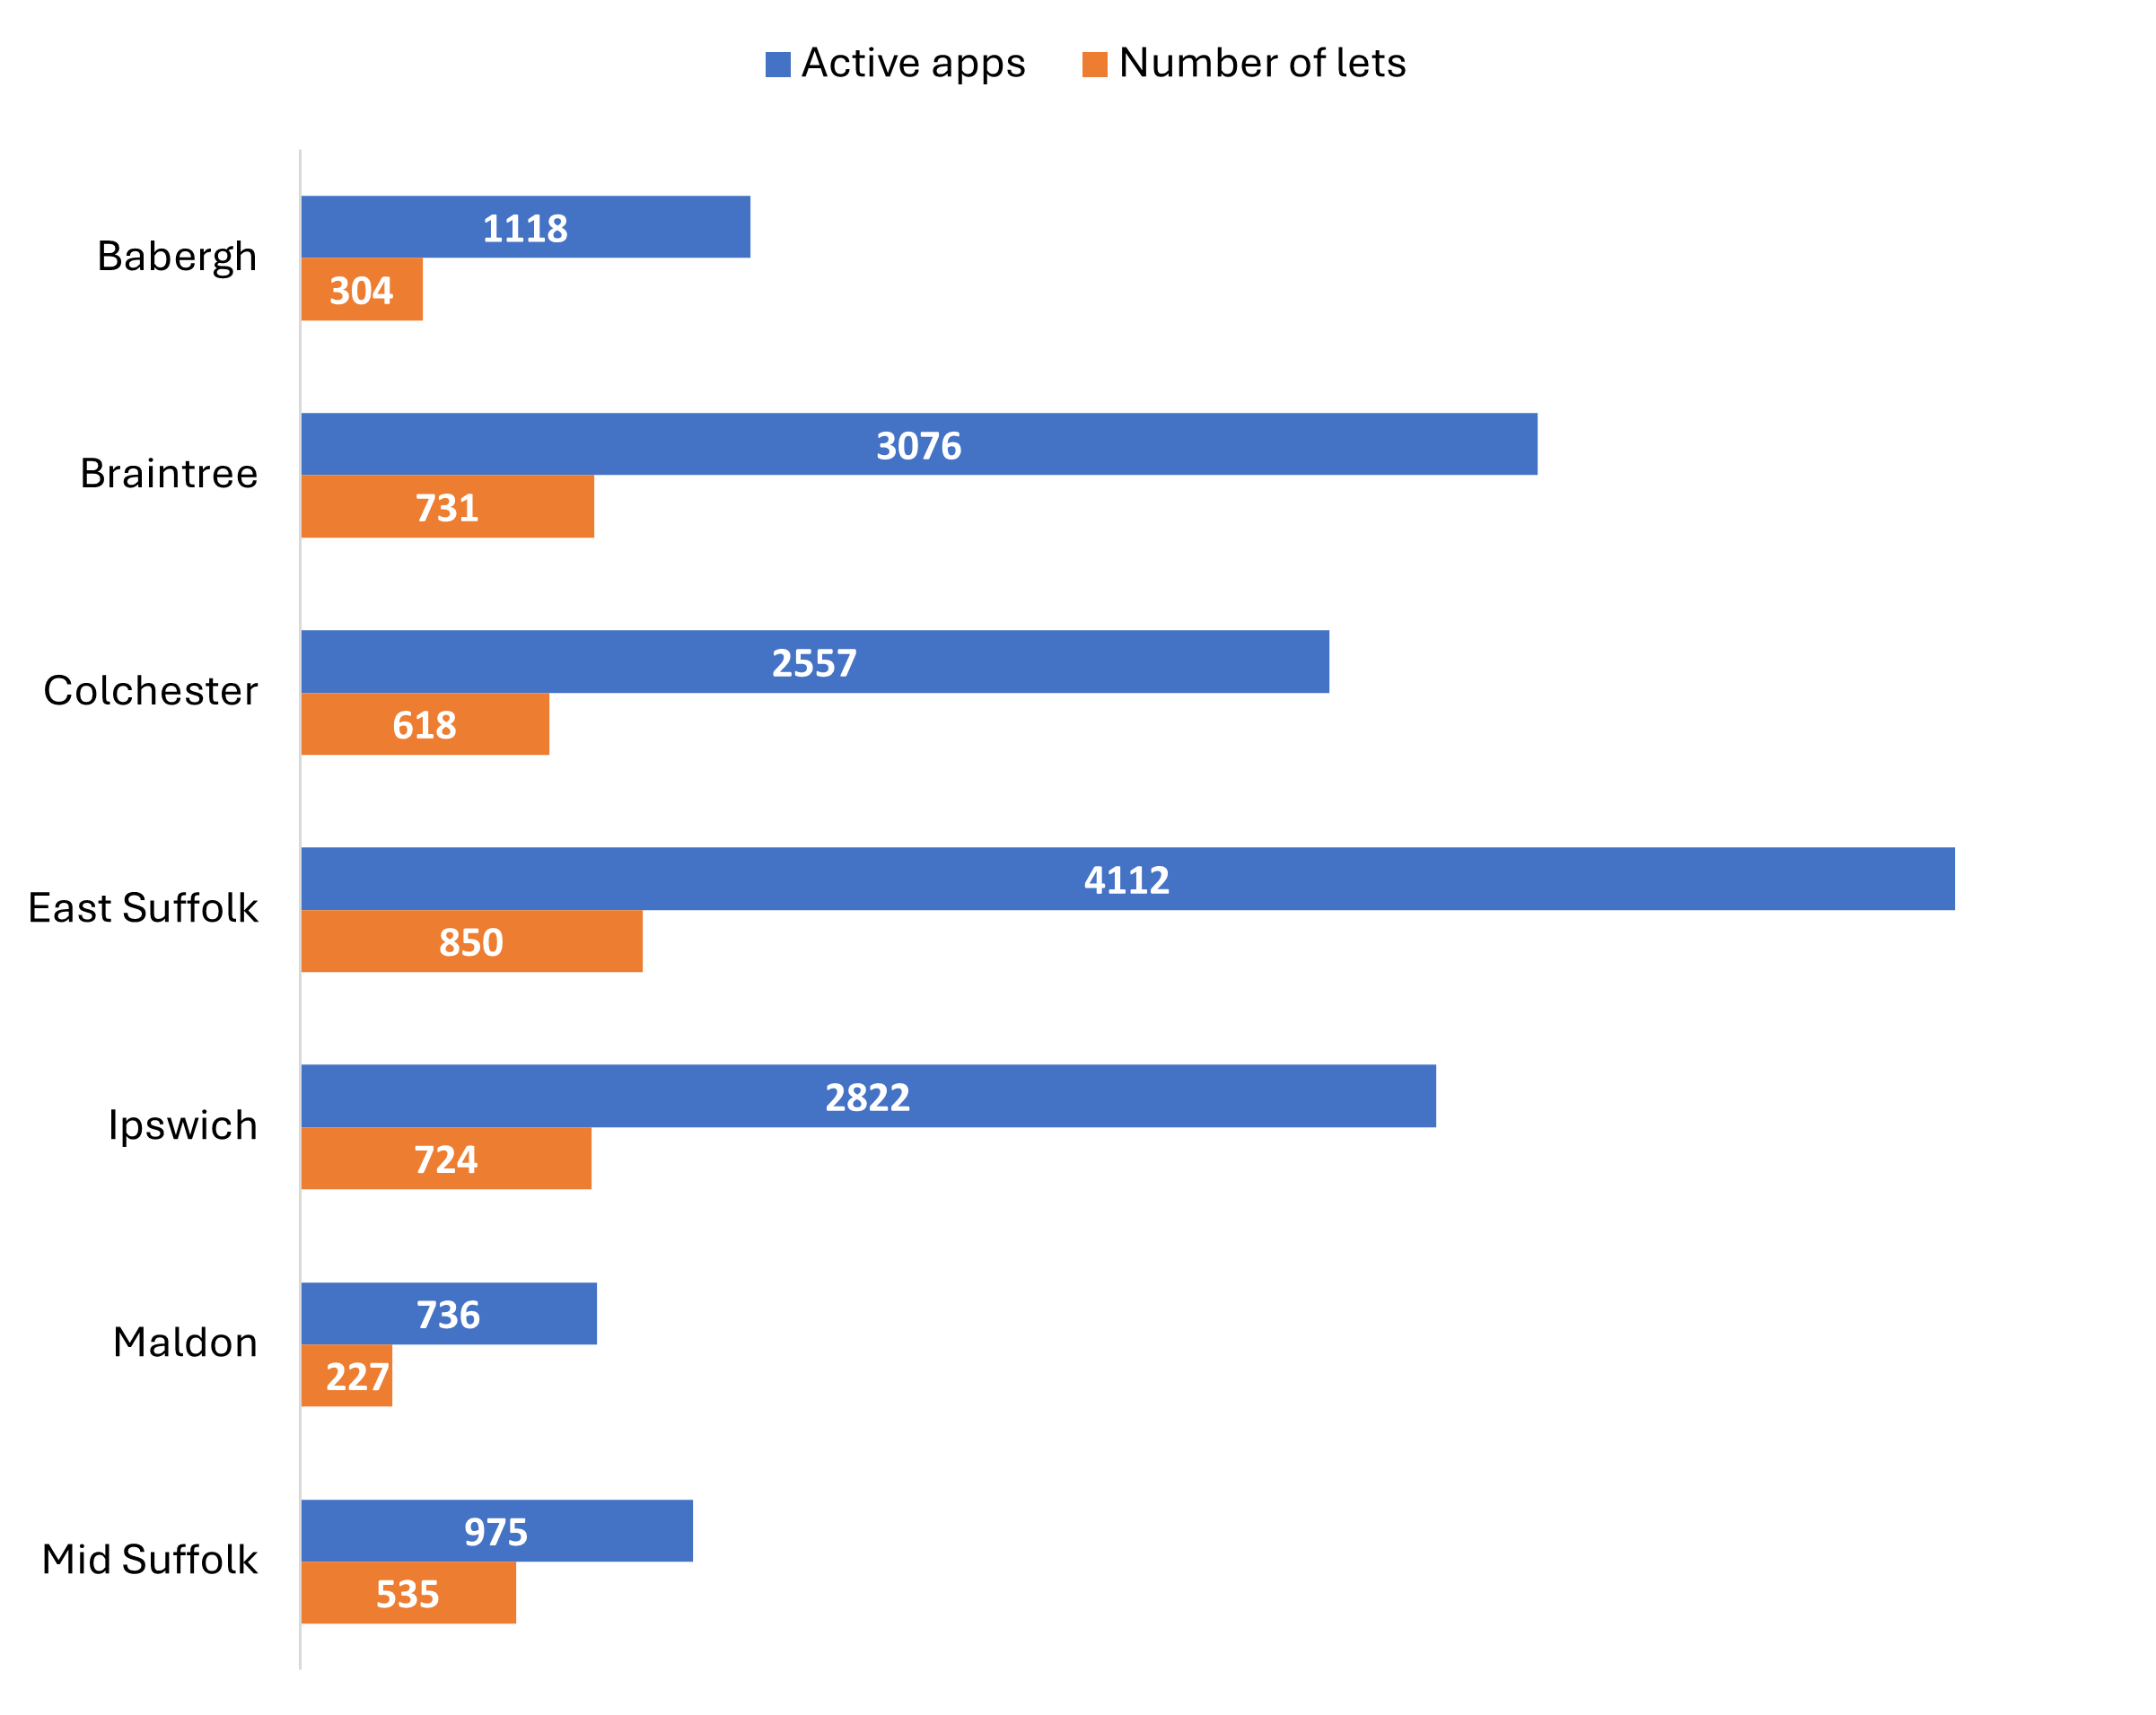
The data below compares the number of registered applicants on 1st April 2026 with the number of lettings made during the previous financial year 2025 - 26. The data shows the balance between the number of households waiting for social housing and the number being housed.
The next chart compares lets of new housing with lets of existing properties:
In total, there were 978 newly built properties let within the Gateway. The chart below shows the number of newly built properties which have adaptations.
The following chart shows the breakdown of lets in 2025 - 26 to new housing, existing housing and compares these to the total amount of social housing stock in that area[1]:
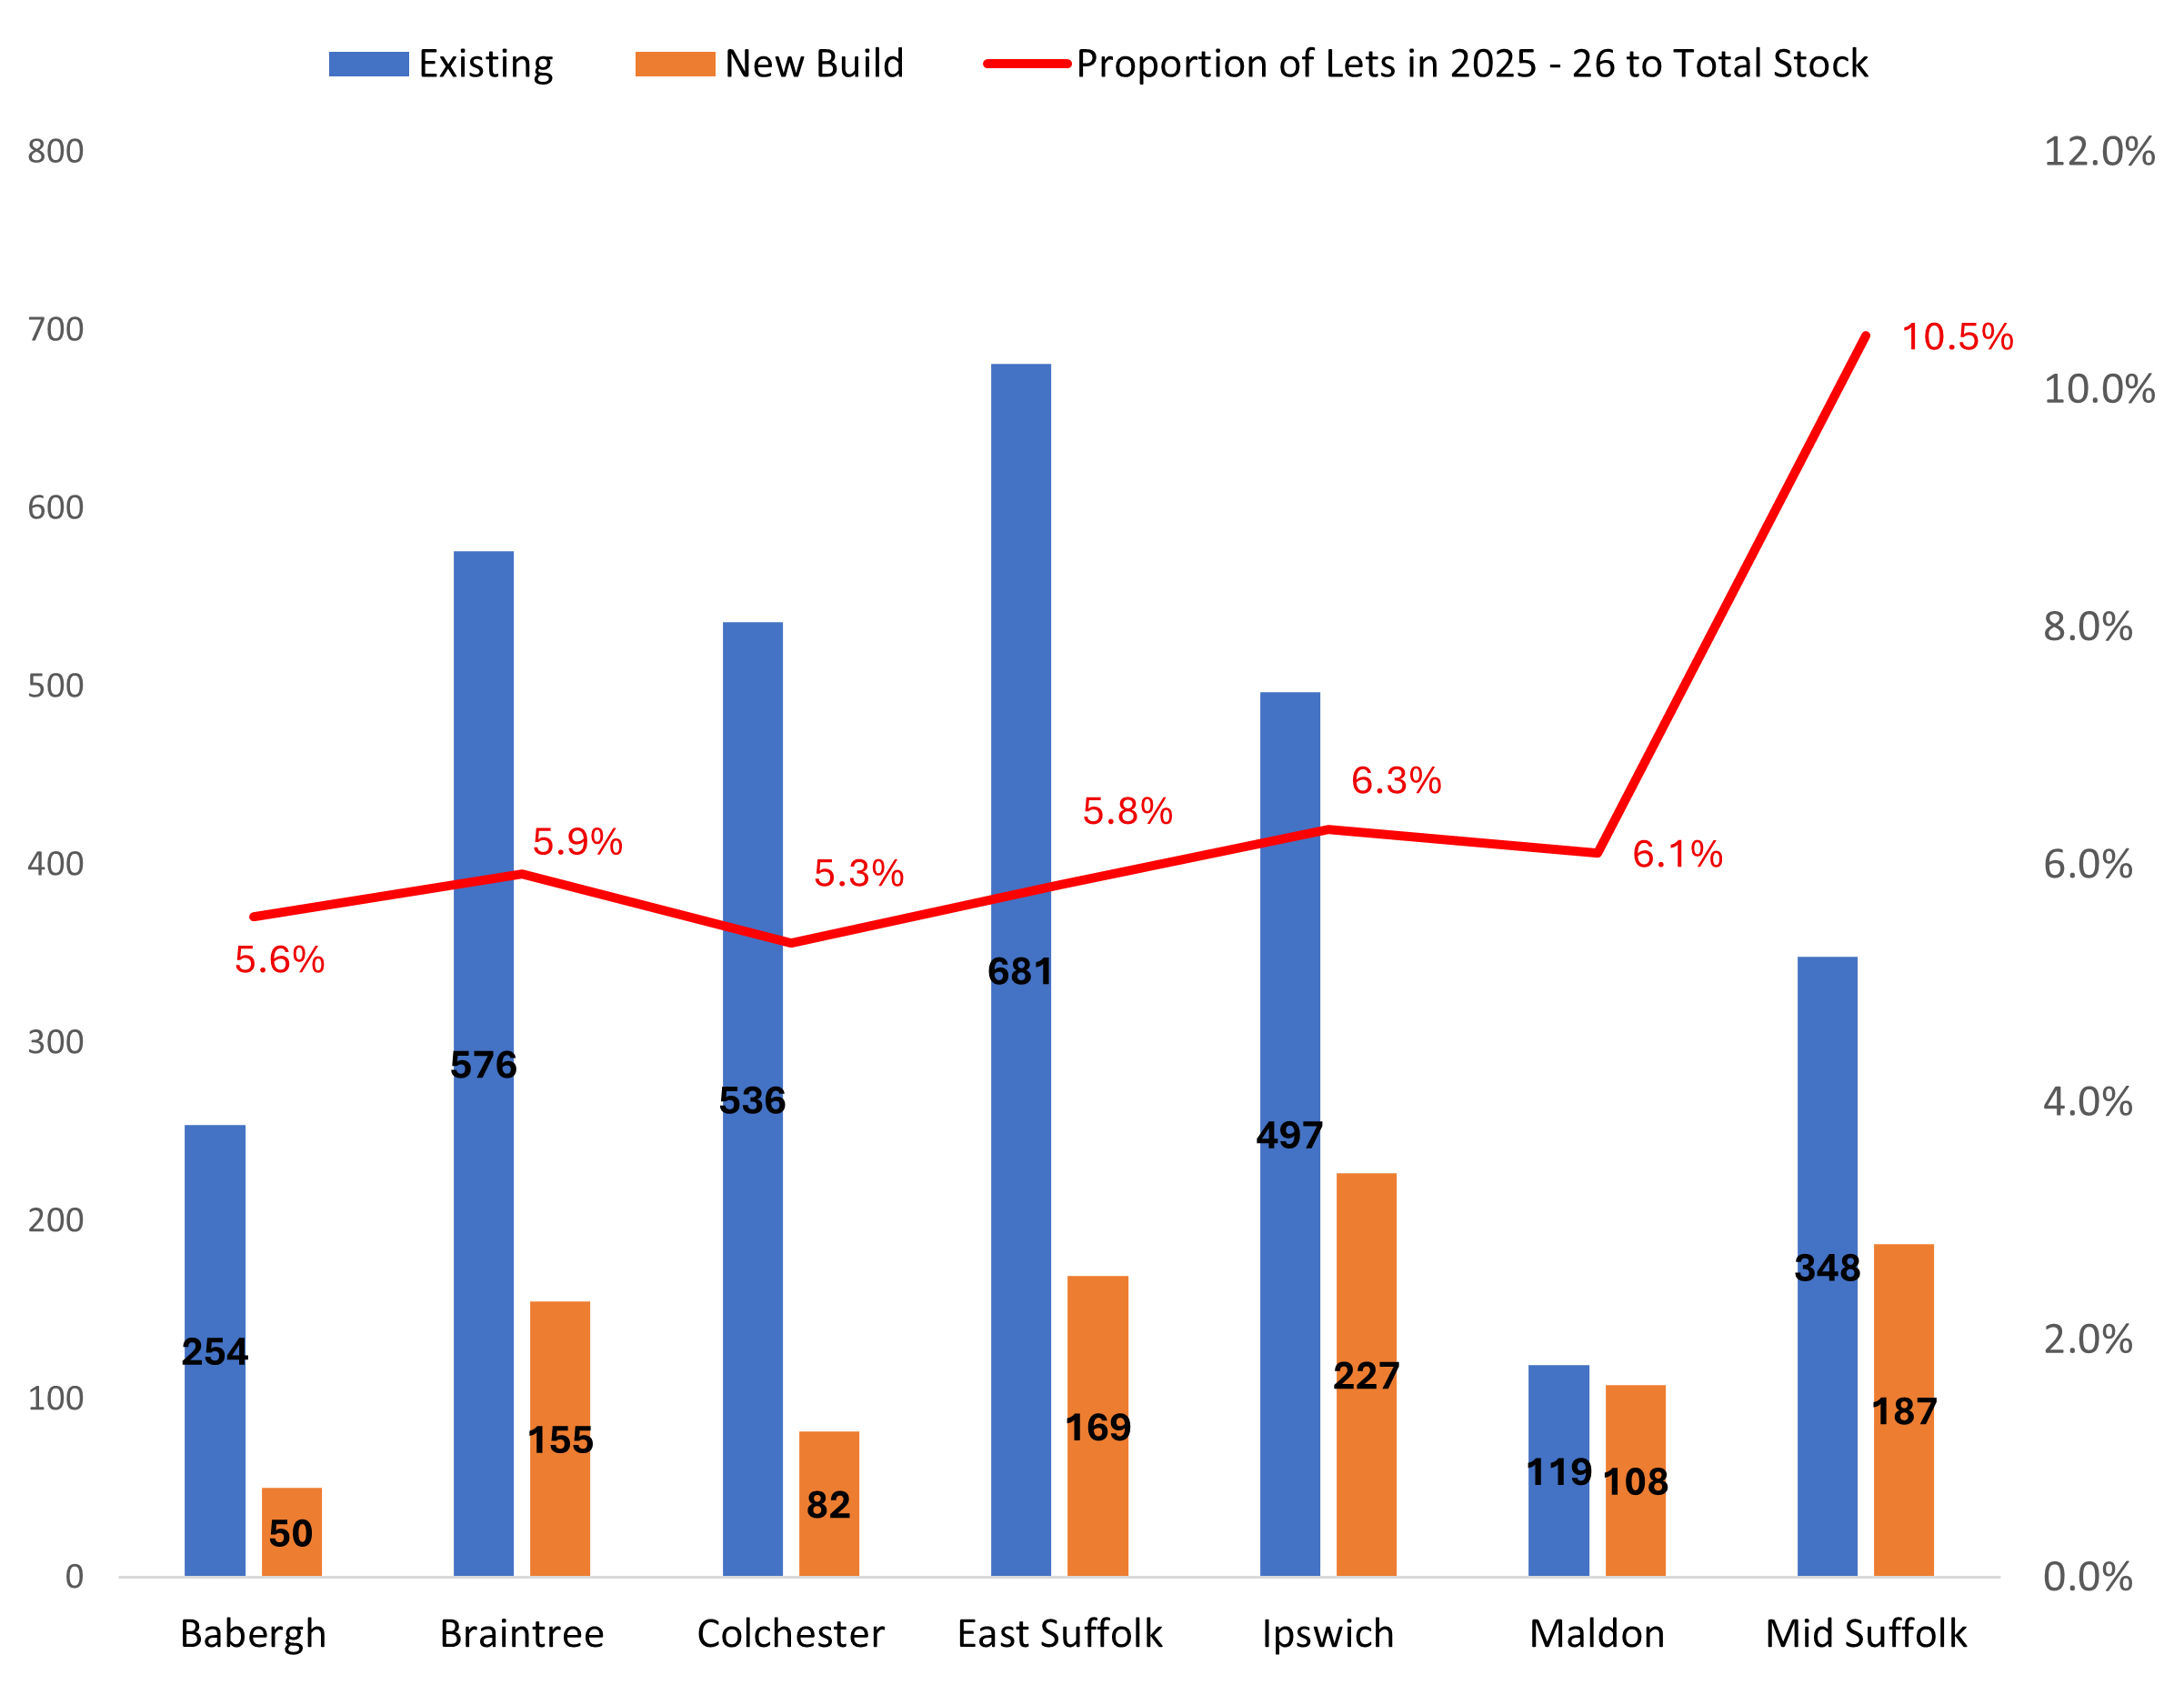
[1] Total amount of social housing in each LA is taken from the following:
|
Local authority |
Source for total stock figures |
|
Babergh |
Live tables on dwelling stock (including vacants) - GOV.UK – table 100 |
|
Braintree DC |
From Braintree DC |
|
Colchester |
Live tables on dwelling stock (including vacants) - GOV.UK – table 100 |
|
East Suffolk |
Live tables on dwelling stock (including vacants) - GOV.UK – table 100 |
|
Ipswich |
Registered provider social housing stock and rents in England 2024 to 2025 - GOV.UK |
|
Maldon |
From Maldon DC |
|
Mid Suffolk |
Live tables on dwelling stock (including vacants) - GOV.UK – table 100 |
The data shows the correlation between the age of the main applicant and the size of property let to them. This information can be helpful when planning what sizes of properties to build to meet future demand.
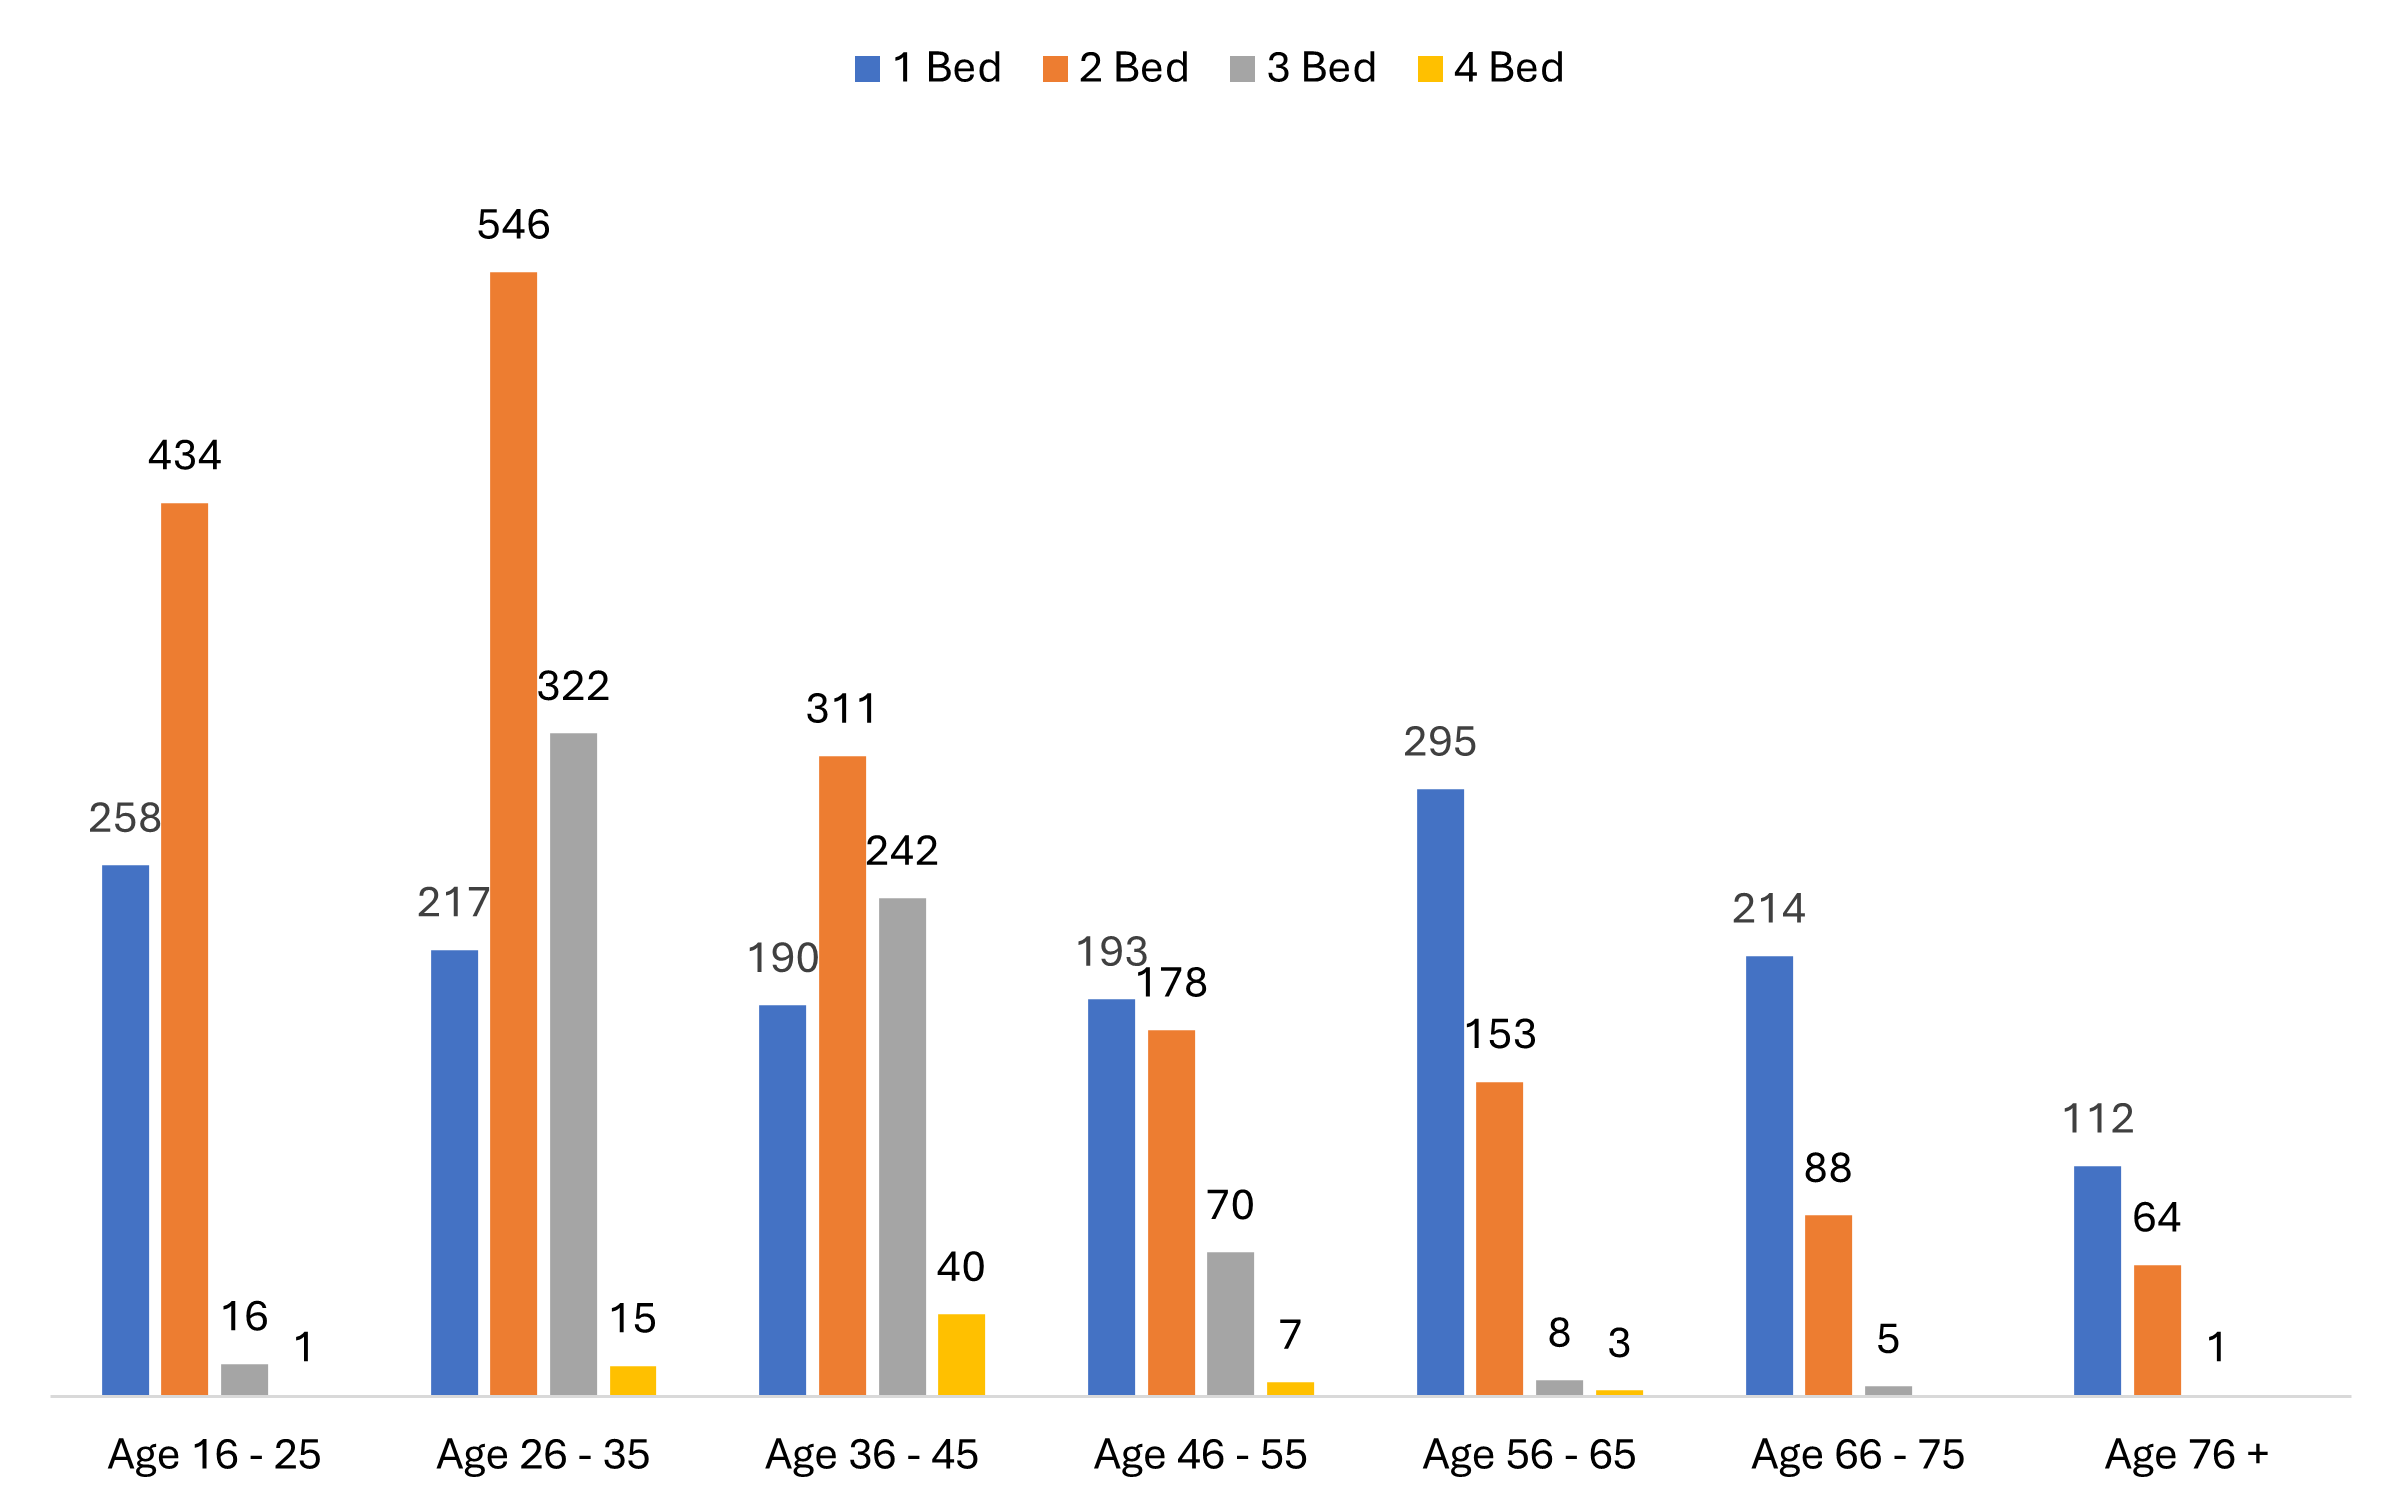
The chart above excludes the five x 5-bedroom properties which were let during the last year. Three of these properties were let to applicants in the 36 - 45 age category; one was let to an applicant aged between 46 and 55 and the other was let to an applicant aged between 56 and 65.
The “Specialist Older Person” category mainly comprises flats in sheltered housing schemes but also includes those properties let that are part of or are linked to sheltered schemes. It is quite common for a few bungalows to be linked to a neighbouring sheltered housing scheme and for the purposes of the graph below, they are included in the ‘specialist older person’ category. The “Bungalow” category in the chart therefore only includes those bungalows let that are not linked to a sheltered scheme.
Future Data Requests
If there is something you would like to see reported on now or in the future, please contact the Gateway to Homechoice team: gateway.coordinators@cbhomes.org.uk